

Question: Write-Up: 1. Based on the horizontal and vertical analysis and the ratios you calculated, select 5 accounts from the income statement and 5 accounts from
Write-Up:
1. Based on the horizontal and vertical analysis and the ratios you calculated, select 5 accounts from the income statement and 5 accounts from the balance sheet that as management of this company you would want to analyze. You must select accounts, not subtotals or totals. You should have a write-up on 10 accounts (5 from the income statement and 5 from the balance sheet). Each account must answer the following 2 questions.
a. For each account you must provide a short explanation (1-2 sentences) of why you choose to analyze this account. Your reasoning for account selection should be based on what you have learned in class, and the results of your horizontal and vertical analysis or ratio calculations. Specifically discuss what on the horizontal and vertical analysis or ratios calculations made you choose this account and this includes stating the exact numbers that caused you to select these accounts. If you choose an account that had minimal change based on your analysis you must support why you choose to look into an account that did not have a big change.
a. After discussing why you selected the accounts, you need to explain what caused the change in the account (1-2 sentences). You can usually find this information from the companys 10-K. Once you find the cause of the change in the account, explain it and cite the page numbers in the 10-K for verification. If you cannot find a valid explanation for the change you must select another account (although most accounts have a reason but it may not be explicitly stated).
For example:
Accounts Receivable, net: I choose this account because it decreased by $XX million and XX% from 2018 to 2019. This account also decreased from X% of total assets in 2018 to X% of total assets in 2019. This account decreased mainly due to the increased allowance for doubtful accounts, which lowered the amount of accounts receivable. The allowance
for doubtful account increased, due to an increase in the age of outstanding account balances at the companys domestic resorts (Marriott, 2020, p. X).
Note: Once you open the 10-K document, use the search function (ctrl+f for Windows or cmd+f for MacOS) to find sections related to the account you are analyzing.
2. Analyze the financial ratios and comment on whether the companys performance has been improving, deteriorating or staying stable over the years for particular ratios. Make sure your assessment relies on the evidence from the ratios calculated. This analysis requires that you comment on each ratio individually and compare the change in the ratio over the two years you analyze.
Analysis and write-up requirements, formatting and submission
1. Horizontal and vertical analysis, and ratio analysis must be completed in MS Excel using formulas. Write-up must be completed in MS Word. Handwritten assignments are unacceptable.
2. On the horizontal and vertical analysis, all dollar figures should be presented exactly like the 10-K and all percentage columns should be shown as percentages with 1 decimal (i.e. 7.2%). Make sure that your all statements are formatted with dollar signs, commas, borders, underlining, etc. and are presentable. Also make sure to note what value your companys dollar values are in, for instance thousands or millions.
3. On the ratios, dollar figures should be rounded to the nearest dollar or cents depending on ratio, coverage and turnover ratios should be presented to 2 decimals (i.e. 1.12 times or 1.12 to 1), and percentage ratios should be shown as percentages with 2 decimal (i.e. 7.25%). Make sure that all ratios are formatted correctly and are presentable.
4. A professional-looking cover page should precede the project write-up with a proper project heading, group number and group member information.
5. An executive summary of your project analysis should follow the cover page. Then, you can include a contents page if you want to (optional). Project write-up should follow contents if contents page is included. References and appendix (if any) should conclude.
6. Write-up formatting: double-spaced, Times New Roman, size 12, and one-inch page margin for all sides.
7. Follow APA format for citations in your write-up.
8. Create a reference page for your report following APA style for the references used in your write-up. 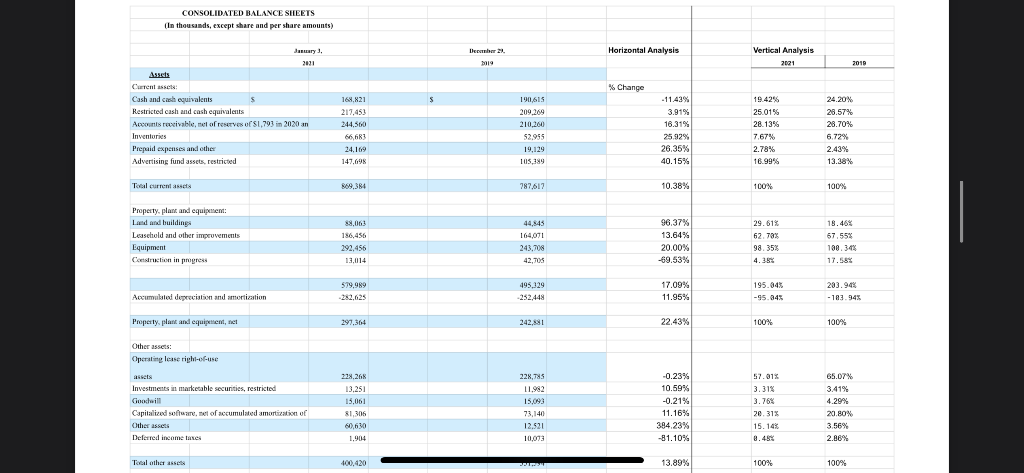
 MMore information could be found on the (SEC) website for domminos pizza
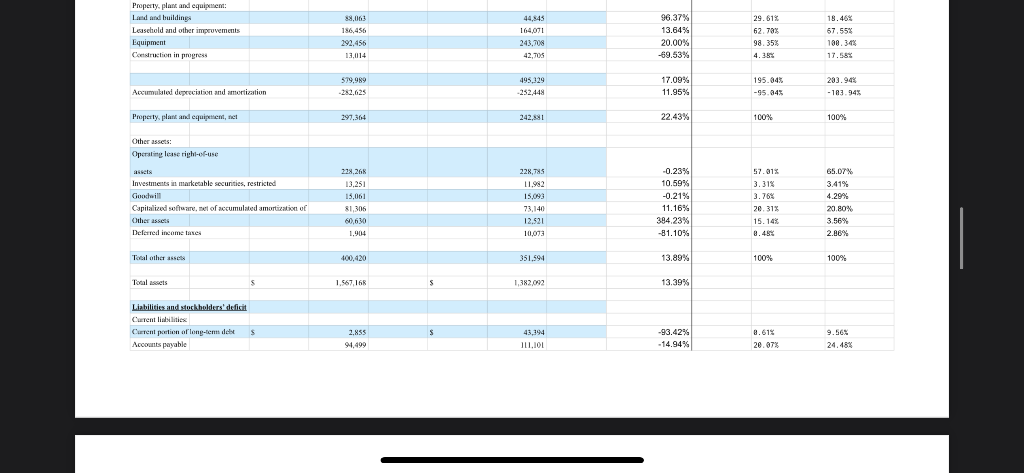
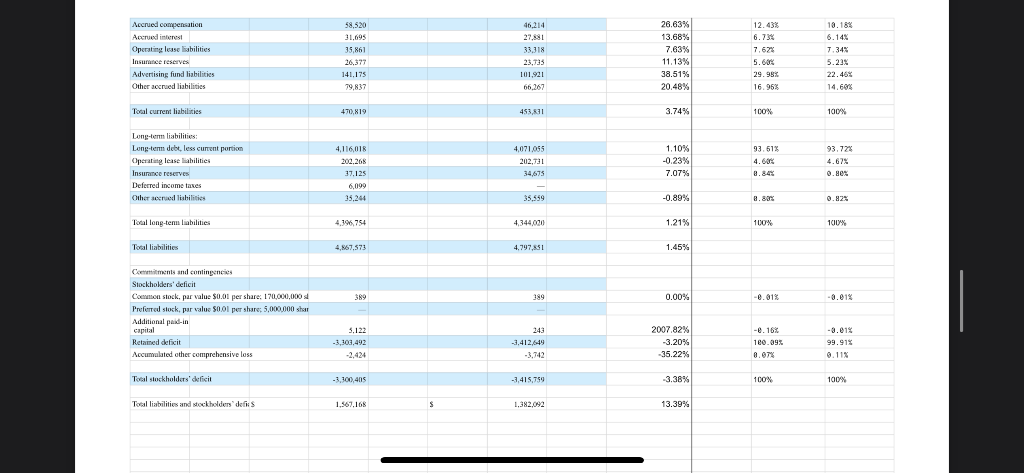
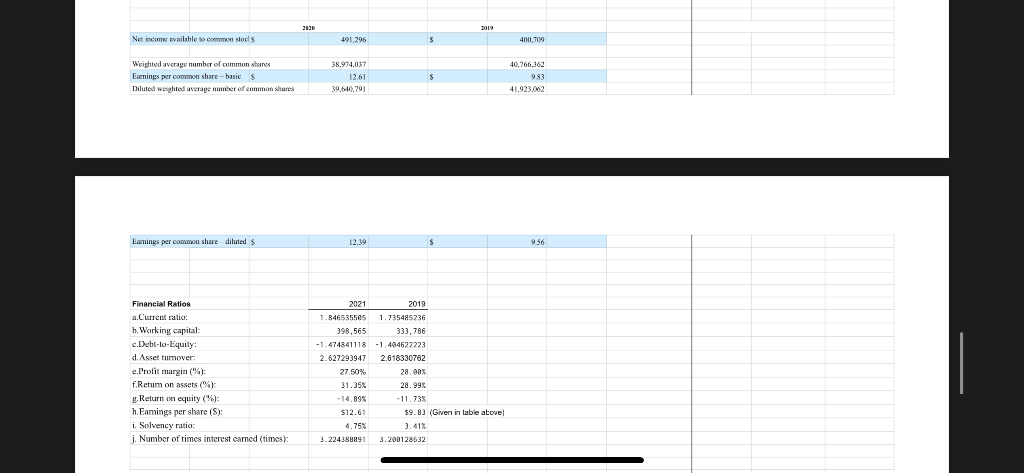
CONSOLIDATED BALANCE SHEETS In thousands, except share and per share amounts) December - Horizontal Analysis Vertical Analysis Vertical Analysis % Change de 25.92% 26.35% 40.15% 20.20 2820 6.72% 2.43% 7.67% 2.78% 24.169 Tocal current and BASKA 10,38% . 100% 1 and amortization 00% 13. 100% Las fuld and her mouvement Equipment Construction in progress 579.999 recision and amortization Property, plant and equipment, net 7973 Operating less the 1.904 400.420 351 COM Total other set Toalets 1.567,166 Liabilities and stockholders' defici Current portion of long-term dice Accounts while 26.63% Accrued compensation Accrued tooted Other accrued liabilities Total current liabilities 470.619 4531 3.74% 00% 9:01 Long-term fiabilities: Long-term dubt, less current portion balance miller Deferred income taxe Other seened liabil 4,116,018 200.20 4,071055 202.7a! 7.07% 35.559 0.89% Total long-term liabilities 4,344,000 4,867,57 1.79 389 380 0004 -0.01% Commitments and contingencies Stockholdere deficit value $0,01 per share: 170,000,000 Preferred stock, po Additional pada Retained deficit Accumulated other comprehensive loss Tocal stockholders' deficit 2007.82% 3,122 Boden 23,41264 -3.300,405 -7,415,759 3.38% 100% 1569 2019 Net income available to commods 491,296 S 400,7041 Weighted average number of common shares Earnings per common share-basics Diluted weighted average number of common shares 38,994,037 12.61 39.640,791 S 40,766,369 983 41.923,062 Earnings per common share diluted s 12.39 $ 9.56 Financial Ratios a.Current ratio: b. Working capital e.Debt-to-Equity: d. Asset tummover e.Profit margin ("%): f.Retum on assets (%) y Return on equity (%): h. Eamings per share (S): i. Solvency ratio: j. Number of times interest camned (times): 2021 2019 1.84653550 1.735485236 398,565 333,786 -1.474841118 -1.404622223 2.627293947 2.618330762 27.50% 28.08% 31.35% 28.99% - 14.89% -11.73% $12.61 $9.83 (Given in table above 4.75% 3.224388091 3.208128632 CONSOLIDATED BALANCE SHEETS In thousands, except share and per share amounts) December - Horizontal Analysis Vertical Analysis Vertical Analysis % Change de 25.92% 26.35% 40.15% 20.20 2820 6.72% 2.43% 7.67% 2.78% 24.169 Tocal current and BASKA 10,38% . 100% 1 and amortization 00% 13. 100% Las fuld and her mouvement Equipment Construction in progress 579.999 recision and amortization Property, plant and equipment, net 7973 Operating less the 1.904 400.420 351 COM Total other set Toalets 1.567,166 Liabilities and stockholders' defici Current portion of long-term dice Accounts while 26.63% Accrued compensation Accrued tooted Other accrued liabilities Total current liabilities 470.619 4531 3.74% 00% 9:01 Long-term fiabilities: Long-term dubt, less current portion balance miller Deferred income taxe Other seened liabil 4,116,018 200.20 4,071055 202.7a! 7.07% 35.559 0.89% Total long-term liabilities 4,344,000 4,867,57 1.79 389 380 0004 -0.01% Commitments and contingencies Stockholdere deficit value $0,01 per share: 170,000,000 Preferred stock, po Additional pada Retained deficit Accumulated other comprehensive loss Tocal stockholders' deficit 2007.82% 3,122 Boden 23,41264 -3.300,405 -7,415,759 3.38% 100% 1569 2019 Net income available to commods 491,296 S 400,7041 Weighted average number of common shares Earnings per common share-basics Diluted weighted average number of common shares 38,994,037 12.61 39.640,791 S 40,766,369 983 41.923,062 Earnings per common share diluted s 12.39 $ 9.56 Financial Ratios a.Current ratio: b. Working capital e.Debt-to-Equity: d. Asset tummover e.Profit margin ("%): f.Retum on assets (%) y Return on equity (%): h. Eamings per share (S): i. Solvency ratio: j. Number of times interest camned (times): 2021 2019 1.84653550 1.735485236 398,565 333,786 -1.474841118 -1.404622223 2.627293947 2.618330762 27.50% 28.08% 31.35% 28.99% - 14.89% -11.73% $12.61 $9.83 (Given in table above 4.75% 3.224388091 3.208128632
Step by Step Solution
There are 3 Steps involved in it

Get step-by-step solutions from verified subject matter experts