Question: X AutoSave On FIN 330 Final Project Spreadsheet Temp... . Last Modified: 52m ago v Search alexis young X File Home Insert Draw Page Layout
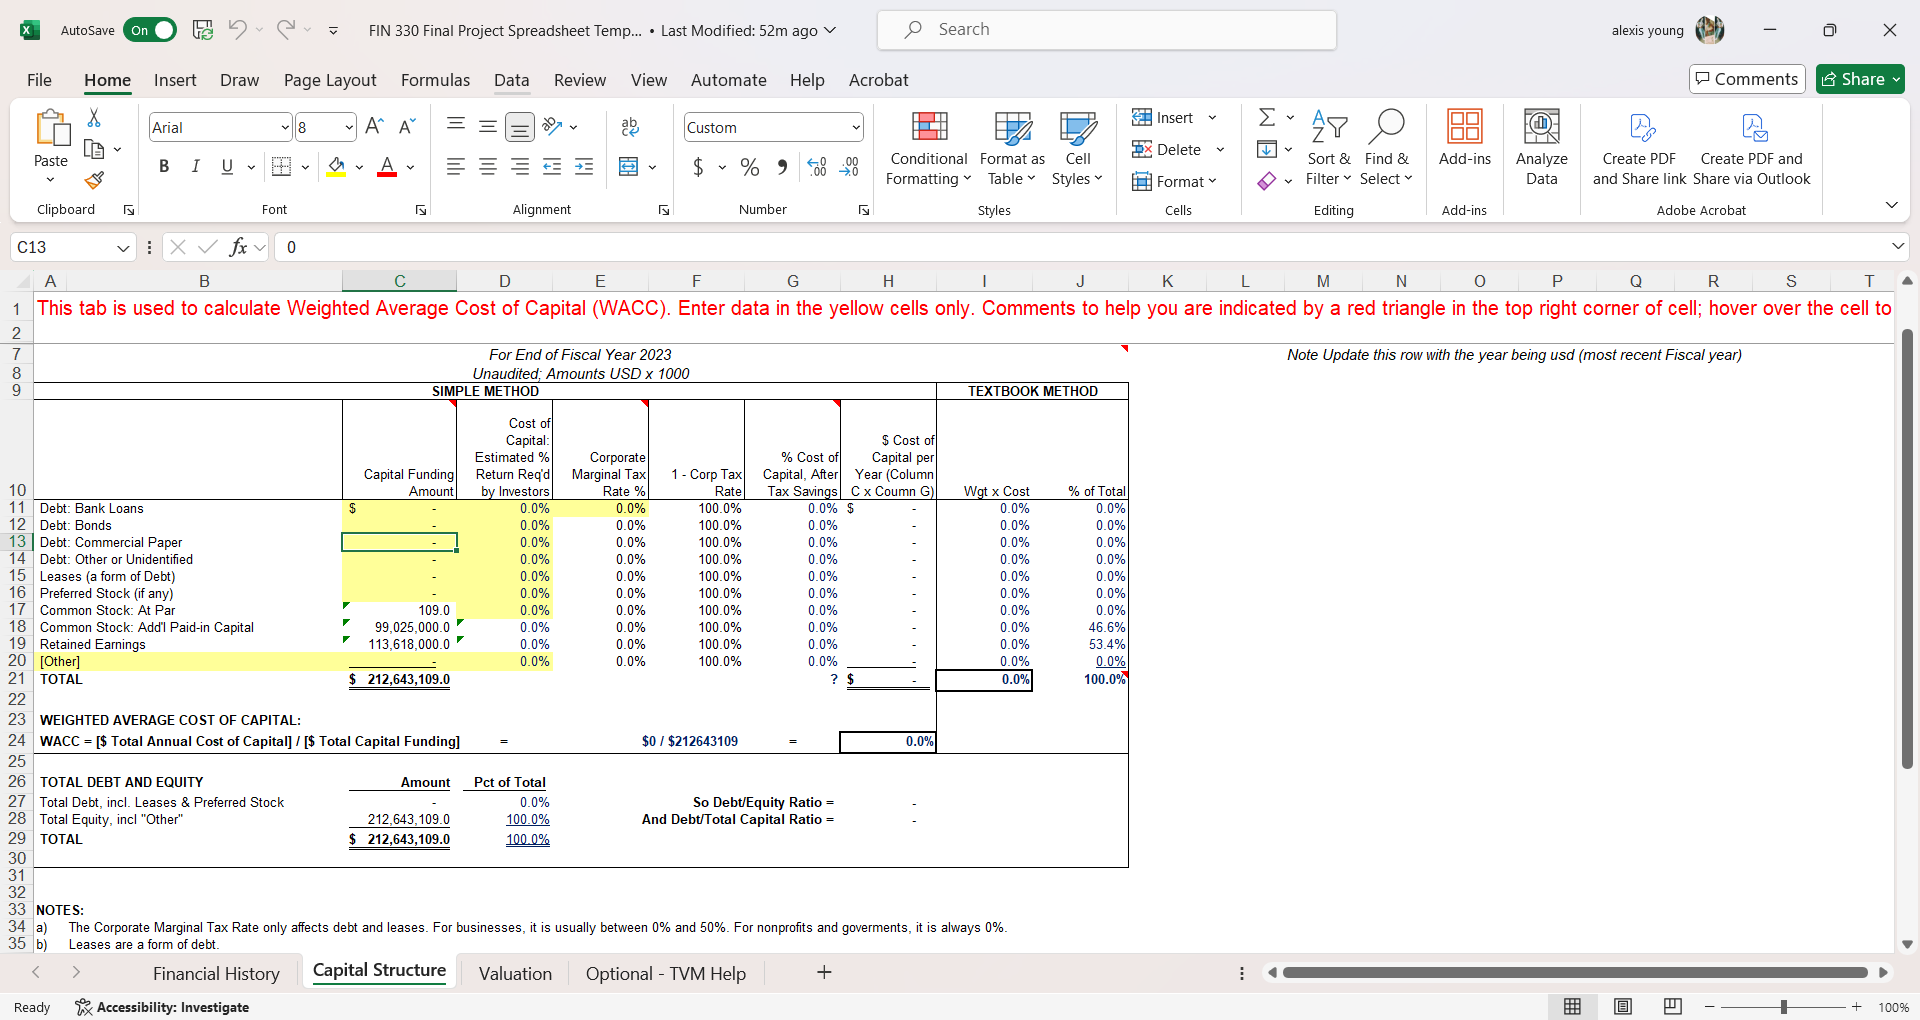
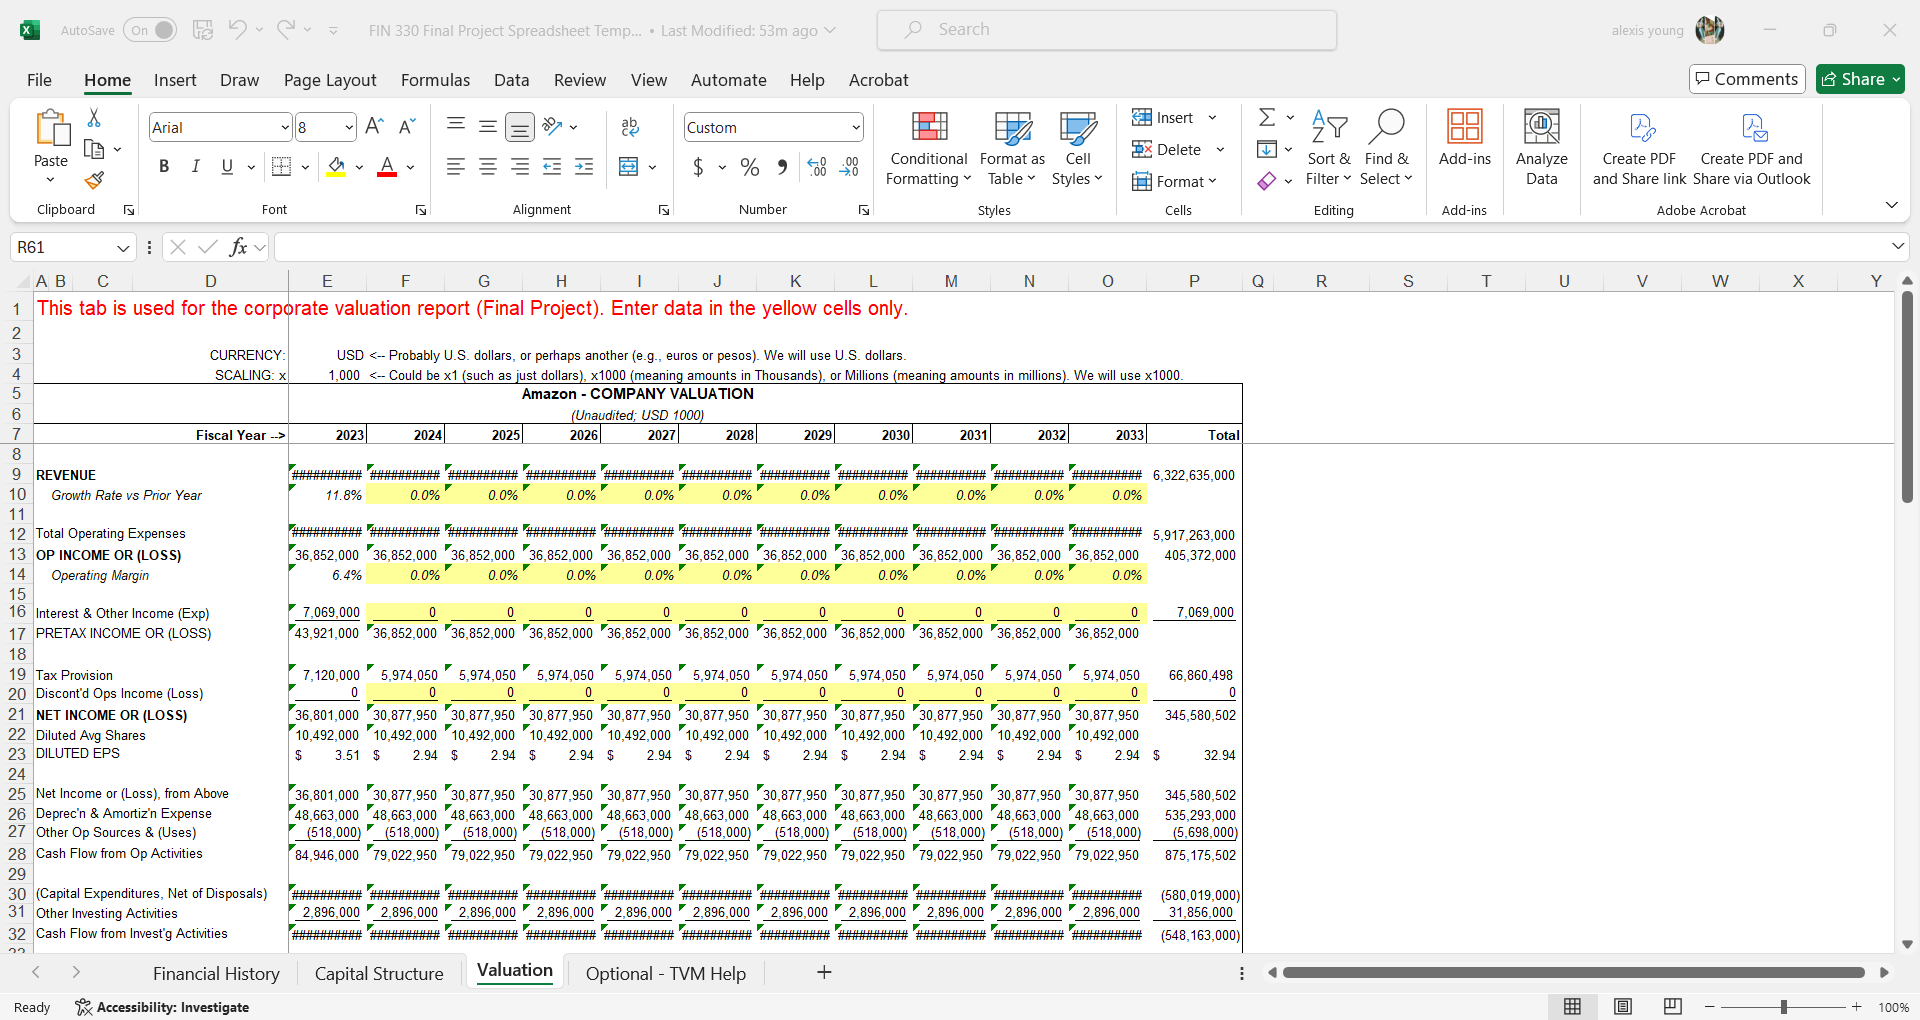
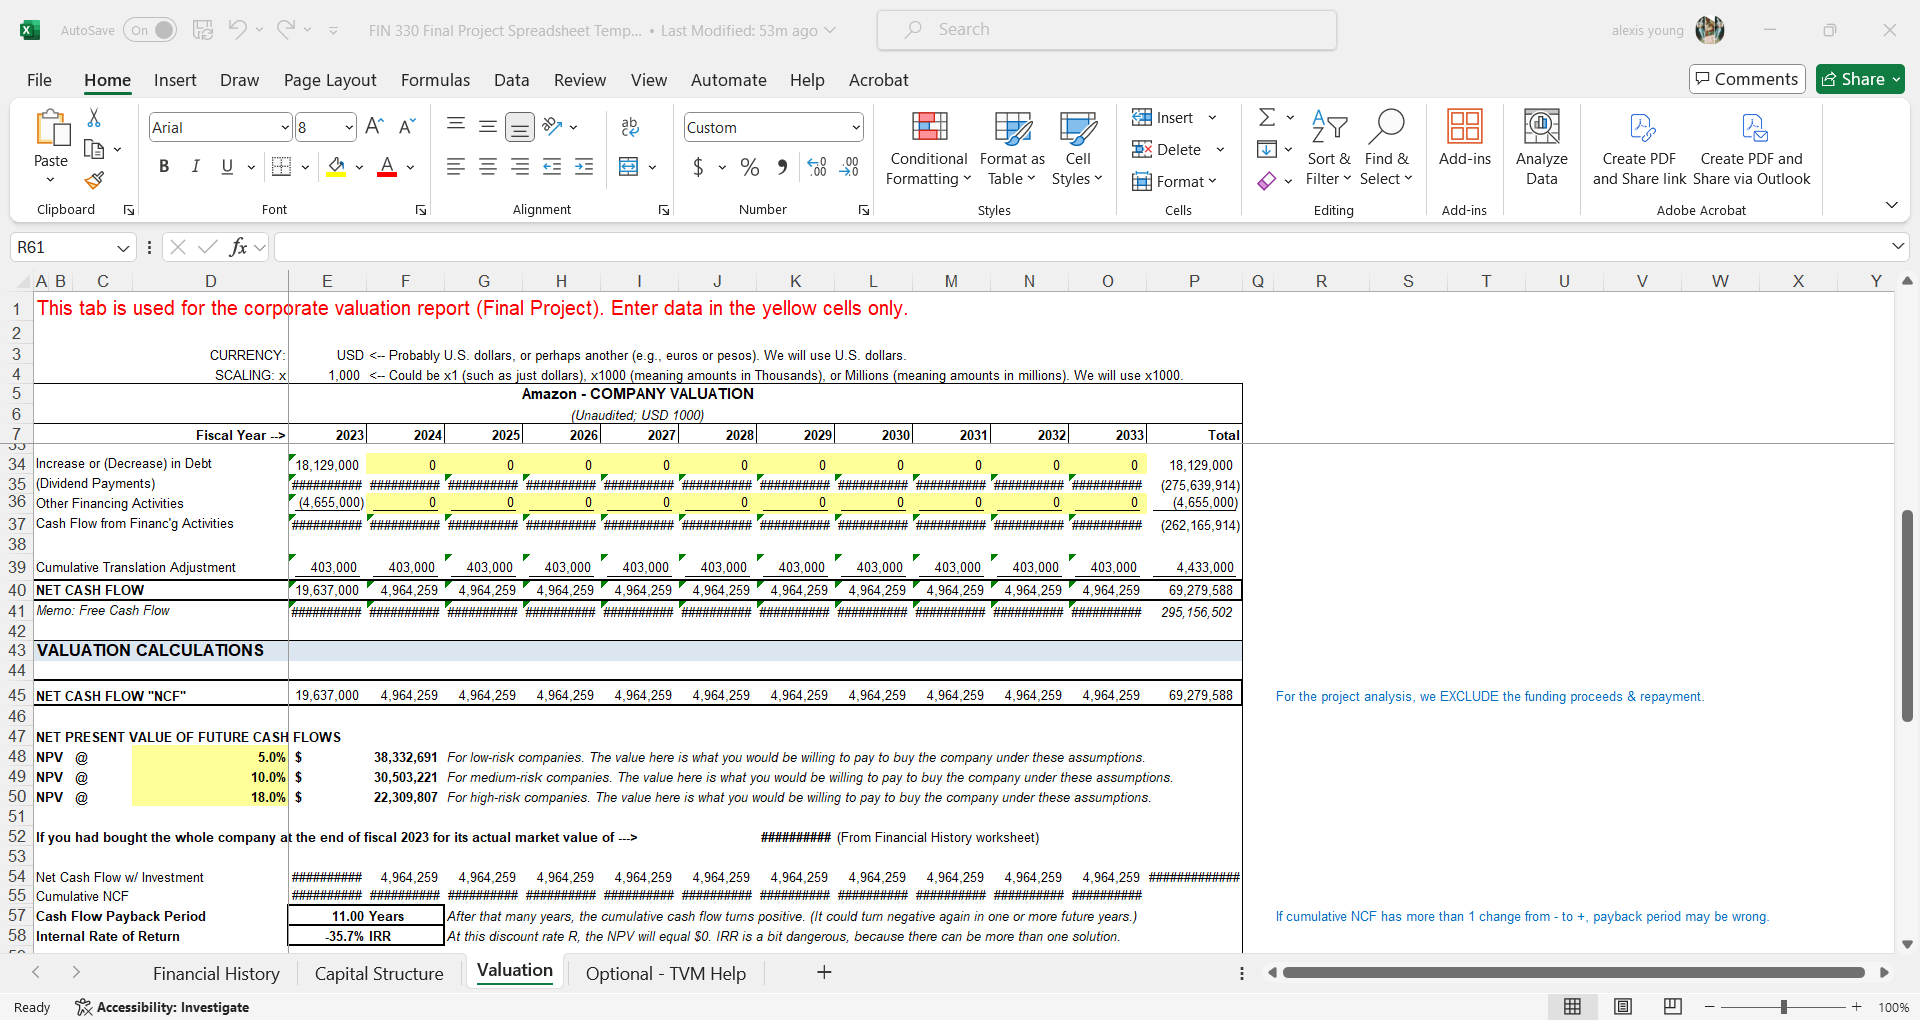
X AutoSave On FIN 330 Final Project Spreadsheet Temp... . Last Modified: 52m ago v Search alexis young X File Home Insert Draw Page Layout Formulas Data Review View Automate Help Acrobat Comments Share Arial V 8 ~ A " A Insert Custom Ex AY O x Delete V V Paste BIUVFLAV E $ ~ % 9 08 Conditional Format as Cell Sort & Find & Add-ins Analyze Create PDF Create PDF and Formatting Table Styles Format Filter ~ Select Data and Share link Share via Outlook Clipboard Font Alignment Number Styles Cells Editing Add-ins Adobe Acrobat C13 vix fro A B D E F G H K M N O P Q R S T This tab is used to calculate Weighted Average Cost of Capital (WACC). Enter data in the yellow cells only. Comments to help you are indicated by a red triangle in the top right corner of cell; hover over the cell to For End of Fiscal Year 2023 Note Update this row with the year being usd (most recent Fiscal year) Unaudited; Amounts USD x 1000 SIMPLE METHOD TEXTBOOK METHOD Cost of Capital: $ Cost of Estimated % Corporate % Cost of Capital per Capital Funding Return Req'd Marginal Tax 1 - Corp Tax Capital, After Year (Column 10 Amount by Investors Rate % Rate Tax Savings C x Coumn G Wgt x Cost % of Total 11 Debt: Bank Loans 0.0% 0.0% 00.0% 0.0% $ 0.0% 0.0% Debt: Bonds 0.0% 0.0% 100.0% 0.0% 0.09 0.09 13 Debt: Commercial Paper 0 0% 0 0% 100.0% 0 0% 0.0% 0.0% 14 Debt: Other or Unidentified 0.0% 0.0% 100.0% 0.0% 0.0% 0.0% 15 Leases (a form of Debt) 0.0% 0.0% 100.0% 0.0% 0.0% 0.0% 16 Preferred Stock (if any) 0.0% 0.0% 100.0% 0.0% 0.0% 0.0% Common Stock: At Par 109.0 0.0% 0.0% 100.0% 0.0% 0_0% 0.0% 18 Common Stock: Add'l Paid-in Capital 99,025,000.0 0.0% 0 0% 100.0% 0 0% 0.0% 46.6% 19 Retained Earnings 113,618,000.0 0.0% 0.0% 100.0% 0.0% 0.0% 53.49% 20 [Other] 0.0% 0.0% 100.0% 0.0% 0.0% 0.0% 21 TOTAL $ 212,643,109.0 0.0% 100.0% 22 23 WEIGHTED AVERAGE COST OF CAPITAL: 24 WACC = [$ Total Annual Cost of Capital] / [$ Total Capital Funding] $0 / $212643109 0.0% 25 26 TOTAL DEBT AND EQUITY Amount Pct of Total 27 Total Debt, incl. Leases & Preferred Stock 0.0% So Debt/Equity Ratio = 28 Total Equity, incl "Other" 212,643, 109.0 100.0% And Debt/Total Capital Ratio = 29 TOTAL $ 212,643, 109.0 100 0% 30 31 32 33 NOTES: 34 a) The Corporate Marginal Tax Rate only affects debt and leases. For businesses, it is usually between 0% and 50%. For nonprofits and goverments, it is always 0%. 35 b) Leases are a form of debt. Financial History Capital Structure Valuation Optional - TVM Help + Ready Accessibility: Investigate + 100%AutoSave ( on ) FIN 330 Final Project Spreadsheet Temp... . Last Modified: 53m ago v Search alexis young X File Home Insert Draw Page Layout Formulas Data Review View Automate Help Acrobat Comments Share Arial V 8 ~ A " A Custom Insert Ex AY O Paste E $ ~ % 9 08 Conditional Format as Cell Delete V V Sort & Find & Add-ins Analyze Create PDF Create PDF and Formatting Table v Styles v Format Filter > Select Data and Share link Share via Outlook Clipboard Font Alignment Number Styles Cells Editing Add-ins Adobe Acrobat R61 vixfry A B C D E F G H K M N O P Q R S T U V W X Y This tab is used for the corporate valuation report (Final Project). Enter data in the yellow cells only. CURRENCY: USD 2023 2024 2025 2026 2027 2028 2029 2030 2031 2032 2033 Total REVENUE 10 Growth Rate vs Prior Year 11.8% 0.0% 0.0% 0.0% 0.0% 0.0% 0.0% 0.0% 0.0% 0.0% 0.0% 11 12 Total Operating Expenses 13 OP INCOME OR (LOSS) 36,852,000 36,852,000 36,852,000 36,852,000 36,852,000 36,852,000 36,852,000 36,852,000 36,852,000 36,852,000 36,852,000 405,372,000 14 Operating Margin 6.4% 0.0% 0.0% 0.0% 0.0% 0.0% 0.0% 0.0% 0.0% 0.0% 0.0% 15 16 Interest & Other Income (Exp) 7,069,000 0 0 0 0 0 0 7,069,000 17 PRETAX INCOME OR (LOSS) 43,921,000 36,852,000 36,852,000 36,852,000 36,852,000 36,852,000 36,852,000 36,852,000 36,852,000 36,852,000 36,852,000 18 19 Tax Provision 7, 120,000 5,974,050 5,974,050 5,974,050 5,974,050 5,974,050 5,974,050 5,974,050 5,974,050 5,974,050 5,974,050 66,860,498 20 Discont'd Ops Income (Loss) 0 0 0 0 21 NET INCOME OR (LOSS) 36,801,000 30,877,950 30,877,950 30,877,950 30,877,950 30,877,950 30,877,950 30,877,950 30,877,950 30,877,950 30,877,950 345,580,502 22 Diluted Avg Shares 10,492,000 10,492,000 10,492,000 10,492,000 10,492,000 10,492,000 10,492,000 10,492,000 10,492,000 10,492,000 10,492,000 23 DILUTED EPS 3.51 $ 2.94 $ 2.94 $ 2.94 $ 2.94 $ 2.94 $ 2.94 $ 2.94 $ 2.94 $ 2.94 $ 2.94 $ 32.94 24 25 Net Income or (Loss), from Above 36,801,000 30,877,950 30,877,950 30,877,950 30,877,950 30,877,950 30,877,950 30,877,950 30,877,950 30,877,950 30,877,950 345,580,502 26 Deprec'n & Amortiz'n Expense 48,663,000 48,663,000 48,663,000 48,663,000 48,663,000 48,663,000 48,663,000 48,663,000 48,663,000 48,663,000 48,663,000 535,293,000 27 Other Op Sources & (Uses) (518,000) (518,000) (518,000) (518,000) (518,000) (518,000) (518,000) (518,000) (518,000) (518,000) (518,000) (5,698,000) 28 Cash Flow from Op Activities 84,946,000 79,022,950 79,022,950 79,022,950 79,022,950 79,022,950 79,022,950 79,022,950 79,022,950 79,022,950 79,022,950 875, 175,502 29 30 (Capital Expenditures, Net of Disposals) *### (580,019,000) 31 Other Investing Activities 2,896,000 2,896,000 2,896,000 2,896,000 2,896,000 2,896,000 2,896,000 2,896,000 2,896,000 2,896,000 2,896,000 31,856,000 32 Cash Flow from Invest'g Activities # # # # # ##### ########## (548, 163,000) Financial History Capital Structure Valuation Optional - TVM Help + Ready Accessibility: Investigate + 100%AutoSave ( on ) FIN 330 Final Project Spreadsheet Temp... . Last Modified: 53m ago v Search alexis young X File Home Insert Draw Page Layout Formulas Data Review View Automate Help Acrobat Comments Share Arial V 8 ~ A " A Custom Insert Ex AY O Delete V V Paste E $ ~ % 9 08 Conditional Format as Cell Sort & Find & Add-ins Analyze Create PDF Create PDF and Formatting Table v Styles v Format Filter > Select Data and Share link Share via Outlook Clipboard Font Alignment Number Styles Cells Editing Add-ins Adobe Acrobat R61 vixfry A B C D E F G H K M N O P Q R S T U V W X Y This tab is used for the corporate valuation report (Final Project). Enter data in the yellow cells only. CURRENCY: USD 2023 2024 2025 2026 2027 2028 2029 2030 2031 2032 2033 Total 34 Increase or (Decrease) in Debt 18, 129,000 18, 129,000 35 (Dividend Payments (275,639,914) 36 Other Financing Activities 14,655,000 0 0 0 0 0 0 0 0 0 (4,655,000) 37 Cash Flow from Financ'g Activities (262, 165,914) 38 39 Cumulative Translation Adjustment 403,000 403,000 403,000 403,000 403,000 403,000 403,000 403,000 403,000 403,000 403,000 4,433,000 40 NET CASH FLOW 19,637,000 4,964,259 4,964,259 4,964,259 4,964,259 4,964,259 1,964,259 4,964,259 4,964,259 4,964,259 4 259 69,279,588 41 Memo: Free Cash Flow 295, 156,502 42 43 VALUATION CALCULATIONS 44 45 NET CASH FLOW "NCF" 19,637,000 4,964,259 4,964,259 4,964,259 4,964,259 4,964,259 4 4,964,259 4,964,259 4,964,259 4,964,259 4,964,259 69,279,588 For the project analysis, we EXCLUDE the funding proceeds & repayment. 46 47 NET PRESENT VALUE OF FUTURE CASH FLOWS 48 NPV @ 5.0% $ 38,332,691 For low-risk companies. The value here is what you would be willing to pay to buy the company under these assumptions. 49 NPV @ 10.0% $ 30,503,221 For medium-risk companies. The value here is what you would be willing to pay to buy the company under these assumptions. 50 NPV @ 18.0% $ 22,309,807 For high-risk companies. The value here is what you would be willing to pay to buy the company under these assumptions. 51 52 If you had bought the whole company at the end of fiscal 2023 for its actual market value of ---> ########## (From Financial History worksheet) 53 54 Net Cash Flow w/ Investment #WWWWWWWWW# 4,964,259 4,964,259 4,964,259 4,964,259 4,964,259 4,964,259 4,964,259 4,964,259 4,964,259 4,964,259 #WWWWWW!IIIIIIIII# 55 Cumulative NCF 57 Cash Flow Payback Period 11.00 Years After that many years, the cumulative cash flow turns positive. (It could turn negative again in one or more future years.) If cumulative NCF has more than 1 change from - to +, payback period may be wrong. 58 Internal Rate of Return 35.7% IRR At this discount rate R, the NPV will equal $0. IRR is a bit dangerous, because there can be more than one solution. Financial History Capital Structure Valuation Optional - TVM Help + Ready Accessibility: Investigate 100%
Step by Step Solution
There are 3 Steps involved in it
1 Expert Approved Answer
Step: 1 Unlock
Question Has Been Solved by an Expert!
Get step-by-step solutions from verified subject matter experts
Step: 2 Unlock
Step: 3 Unlock
Students Have Also Explored These Related Finance Questions!