

Question: ( x - bar chart ) A quality control manager at a manufacturing facility has taken four samples ( each column is a sample )
xbar chart A quality control manager at a manufacturing facility has taken four samples
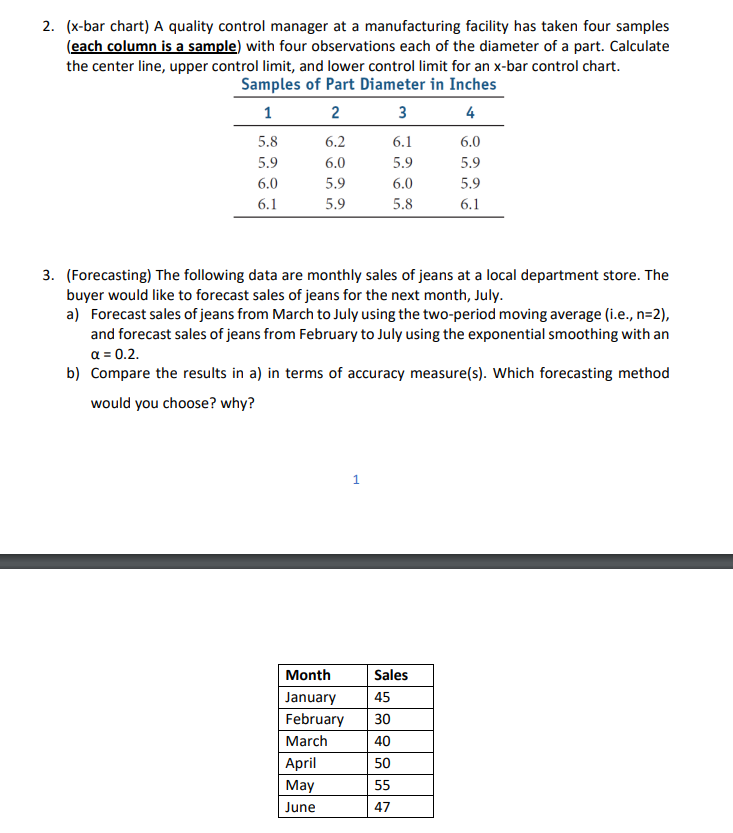
each column is a sample with four observations each of the diameter of a part. Calculate
the center line, upper control limit and lower control limit for an bar control chart.
Forecasting The following data are monthly sales of jeans at a local department store. The
buyer would like to forecast sales of jeans for the next month, July.
a Forecast sales of jeans from March to July using the twoperiod moving average ie
and forecast sales of jeans from February to July using the exponential smoothing with an
b Compare the results in a in terms of accuracy measures Which forecasting method
would you choose? why?
Step by Step Solution
There are 3 Steps involved in it
1 Expert Approved Answer
Step: 1 Unlock

Question Has Been Solved by an Expert!
Get step-by-step solutions from verified subject matter experts
Step: 2 Unlock
Step: 3 Unlock