

Question: X Gradebook x _ Question 11 - Wk 2 - Practice: W X Course Hero x P ) The First 48 - Peacock C https://ezto.mheducation.com/ext/map/index.html?_con=con&external_browser=0&launchUrl=https%253A%252F%252Fvle.phoenix.edu%252Fultr.
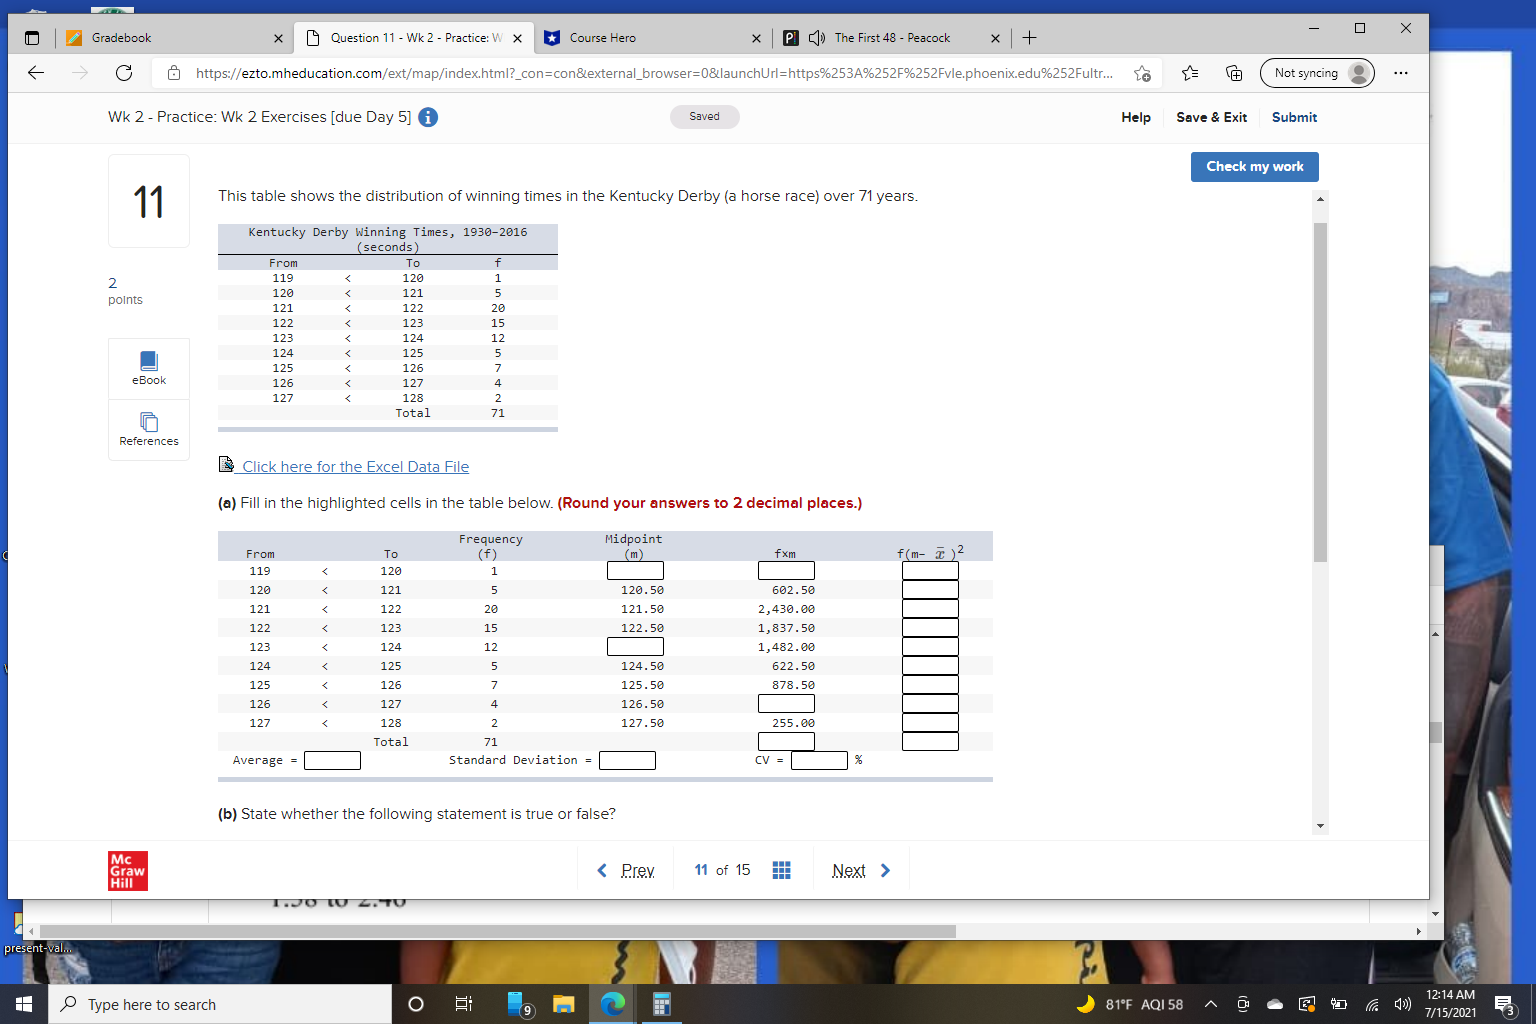
X Gradebook x _ Question 11 - Wk 2 - Practice: W X Course Hero x P ) The First 48 - Peacock C https://ezto.mheducation.com/ext/map/index.html?_con=con&external_browser=0&launchUrl=https%253A%252F%252Fvle.phoenix.edu%252Fultr. Not syncing . . . Wk 2 - Practice: Wk 2 Exercises [due Day 5] Saved Help Save & Exit Submit Check my work 11 This table shows the distribution of winning times in the Kentucky Derby (a horse race) over 71 years. Kentucky Derby Winning Times, 1930-2016 (seconds ) From To 2 119 120 points 120 121 121 122 122 123 15 123 124 12 124 AAAAAAA 125 125 126 Book 126 127 127 128 Total 71 References Click here for the Excel Data File (a) Fill in the highlighted cells in the table below. (Round your answers to 2 decimal places.) Frequency Midpoint From To (t ) (m) fxm f(m- x )2 119 120 1 120 121 120.50 602.50 121 122 20 121.50 2, 430.00 122 123 15 122.50 1, 837.50 123 124 12 1, 482.00 124 125 5 124.50 622.50 125 126 125.50 878.50 126 127 4 126.50 127 128 N . 127.50 255.00 Total 71 Average = Standard Deviation = CV = (b) State whether the following statement is true or false? Mc Grav I.JO W Z. TO present-val.. Type here to search O 81.F AQ1 58 0 - " (() 12:14 AM 9 7/15/2021
Step by Step Solution
There are 3 Steps involved in it

Get step-by-step solutions from verified subject matter experts