

Question: x i Data Table comparative arance sneer December 31, 2018 and 2017 2018 2017 $ 48,600 $ 219,600 31,800 77,500 179,800 52,700 300,000 $ 310,000
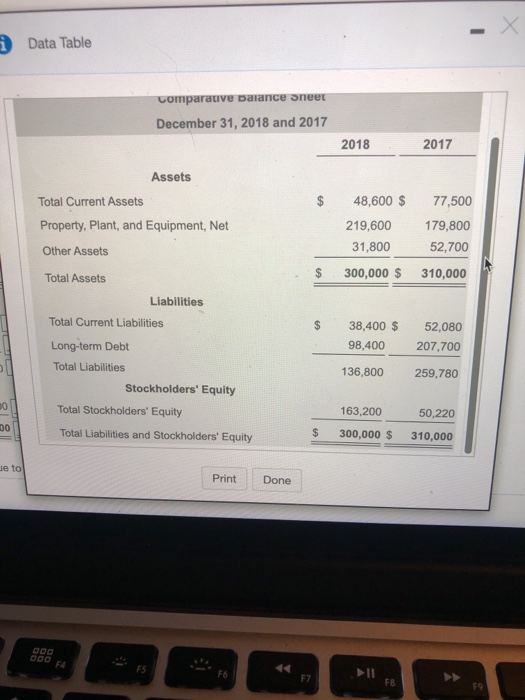
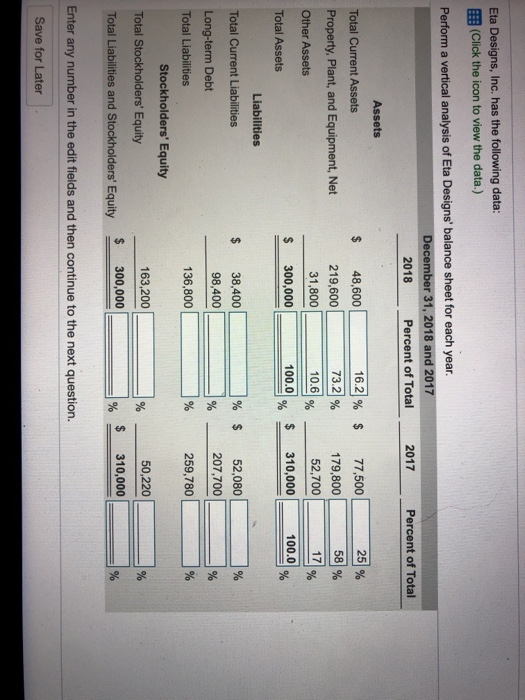
x i Data Table comparative arance sneer December 31, 2018 and 2017 2018 2017 $ 48,600 $ 219,600 31,800 77,500 179,800 52,700 300,000 $ 310,000 Assets Total Current Assets Property, Plant, and Equipment, Net Other Assets Total Assets Liabilities Total Current Liabilities Long-term Debt Total Liabilities Stockholders' Equity Total Stockholders' Equity Total Liabilities and Stockholders' Equity $ 38,400 $ 98,400 52,080 207,700 136,800 259.780 00 163,200 50,220 00 $ 300,000 $ 310,000 Je to Print Done OOO - E5 F6 II F7 FB Eta Designs, Inc. has the following data: (Click the icon to view the data.) Perform a vertical analysis of Eta Designs' balance sheet for each year. December 31, 2018 and 2017 2018 Percent of Total 2017 Percent of Total Assets Total Current Assets 16.21% $ 25 % 48,600 219,600 31,800 73.2 % Property, Plant, and Equipment, Net Other Assets 77,500 179,800 52,700 58 % 10.6 17 % % $ 300,000 100.0 $ 310,000 100.0 Total Assets % % Liabilities % $ % Total Current Liabilities Long-term Debt 38,400 98,400 52,080 207,700 % % Total Liabilities 136,800 % 259,780 % 163,200 Stockholders' Equity Total Stockholders' Equity Total Liabilities and Stockholders' Equity % 50,220 % 300,000 $ % 310,000 % Enter any number in the edit fields and then continue to the next question. Save for Later
Step by Step Solution
There are 3 Steps involved in it

Get step-by-step solutions from verified subject matter experts