

Question: - X Take a Test - Daunyelle Robinson - Google Chrome Lo mathxl.com/Student/PlayerTest.aspx?testld=2335125828centerwin=yes Daunyelle Robinson | 09/19/21 10:47 PM 2021 Fall Session A Math 201-10
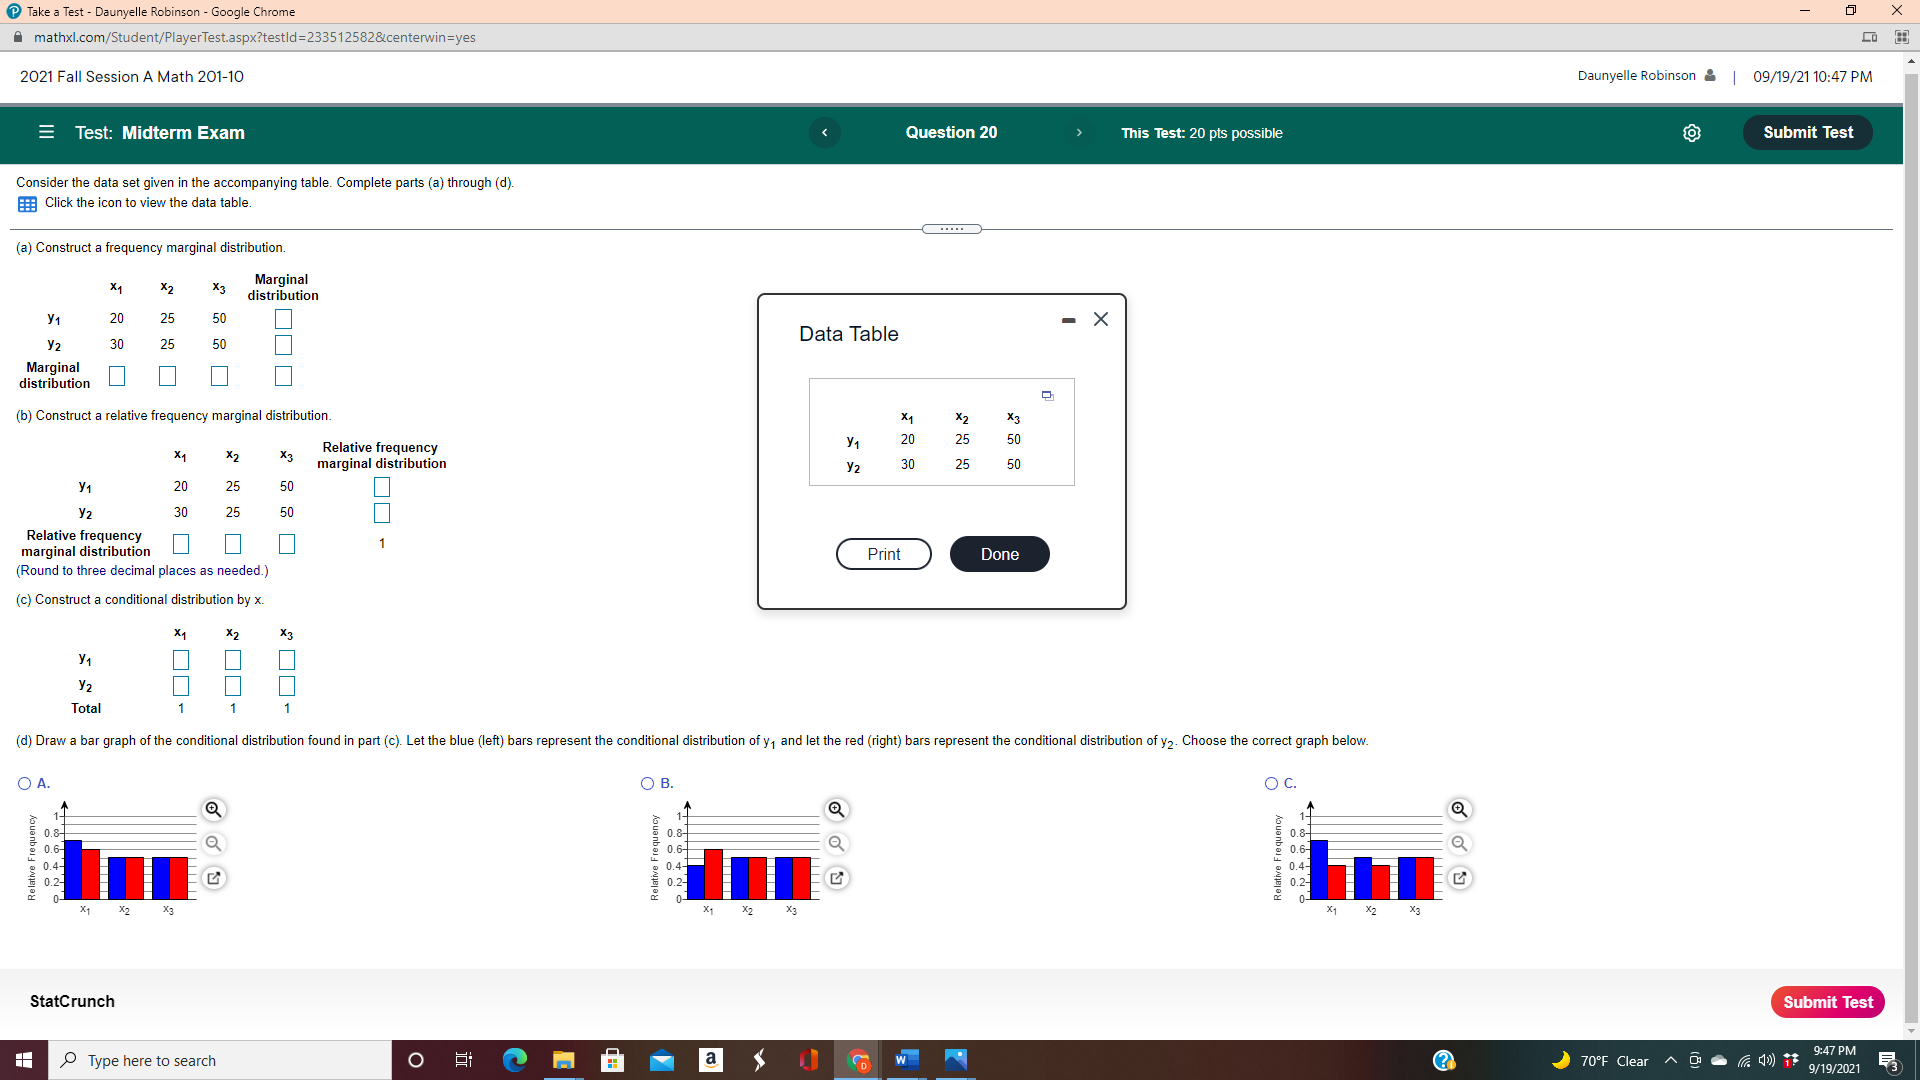
- X Take a Test - Daunyelle Robinson - Google Chrome Lo mathxl.com/Student/PlayerTest.aspx?testld=2335125828centerwin=yes Daunyelle Robinson | 09/19/21 10:47 PM 2021 Fall Session A Math 201-10 This Test: 20 pts possible = Test: Midterm Exam Question 20 Submit Test Consider the data set given in the accompanying table. Complete parts (a) through (d). Click the icon to view the data table. (a) Construct a frequency marginal distribution. Marginal X2 X3 distribution - X V1 20 25 50 Data Table Y2 30 25 50 Marginal distribution (b) Construct a relative frequency marginal distribution. X1 X2 X3 y1 20 25 50 Relative frequency X1 X2 X3 y2 30 25 marginal distribution y1 20 25 50 30 25 50 Relative frequency marginal distribution Print Done (Round to three decimal places as needed.) (c) Construct a conditional distribution by x. X1 X2 y1 -00 3 Y2 Total (d) Draw a bar graph of the conditional distribution found in part (c). Let the blue (left) bars represent the conditional distribution of y, and let the red (right) bars represent the conditional distribution of y2. Choose the correct graph below. A. O B. O C. Relative Frequency Relative Frequency Relative Frequency X3 X 1 X3 X1 X2 X2 X2 Submit Test StatCrunch 9:47 PM 70OF Clear ~ 9 7 1 8 O W 9/19/2021 Type here to search
Step by Step Solution
There are 3 Steps involved in it

Get step-by-step solutions from verified subject matter experts