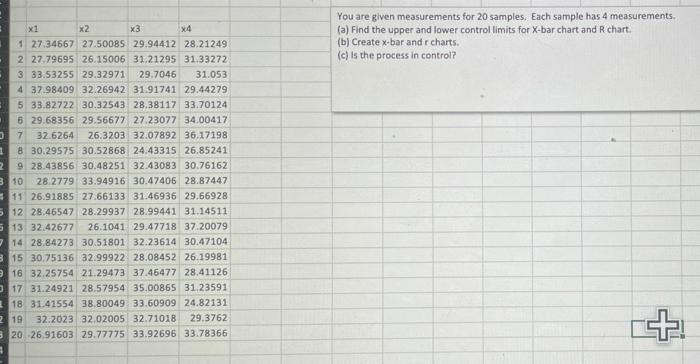
Question: x1 You are given measurements for 20 samples. Each sample has 4 measurements. (a) Find the upper and lower control limits for X-bar chart and

x1 You are given measurements for 20 samples.
x1 You are given measurements for 20 samples. Each sample has 4 measurements. (a) Find the upper and lower control limits for X-bar chart and R chart. (b) Create x-bar and charts. (c) is the process in control? x2 3 X4 1 27.34667 27.50085 29.94412 28.21249 2 27.79695 26.15006 31.21295 31.33272 3 33.53255 29.32971 29.7046 31.053 4 37.98409 32.26942 31.91741 29.44279 5 33.82722 30.32543 28.38117 33.70124 6 29.68356 29.56677 27.23077 34.00417 7 32.6264 26.3203 32.07892 36.17198 830.29575 30.52868 24.43315 26.85241 2 9 28.43856 30.48251 32.43083 30.76162 3 10 28.2779 33.94916 30.47406 28.87447 11 26.91885 27.66133 31.46936 29.66928 5 12 28.46547 28.29937 28.99441 31.14511 513 32.42677 26.1041 29.47718 37.20079 2 14 28.84273 30.51801 32.23614 30.47104 15 30.75136 32.99922 28.08452 26.19981 16 32.25754 21.29473 37.46477 28.41126 317 31.24921 28.57954 35.00865 31.23591 18 31.41554 38.80049 33.60909 24.82131 2 19 32.2023 32.02005 32.71018 29.3762 320 26.91603 29.77775 33.92696 33.78366

Step by Step Solution

There are 3 Steps involved in it

1 Expert Approved Answer
Step: 1 Unlock blur-text-image
Question Has Been Solved by an Expert!

Get step-by-step solutions from verified subject matter experts

Step: 2 Unlock
Step: 3 Unlock

Students Have Also Explored These Related General Management Questions!