

Question: x+2 Use the sliders to set a = 2 and c=2 and graph the function f(x) = Slide the b-slider to various values and observe

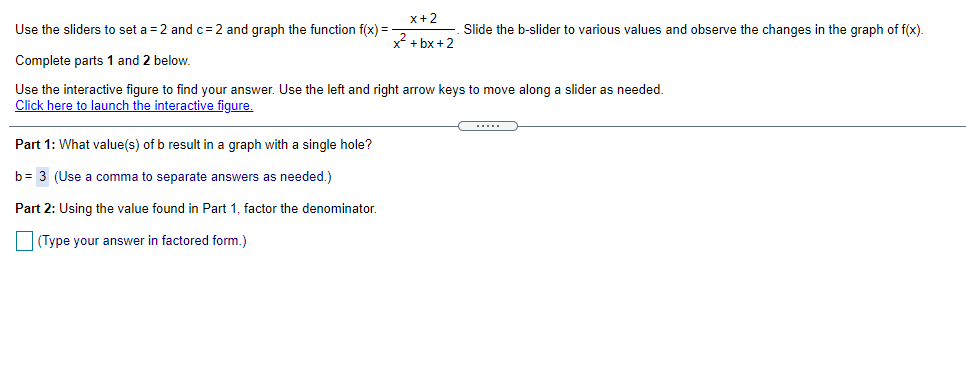
x+2 Use the sliders to set a = 2 and c=2 and graph the function f(x) = Slide the b-slider to various values and observe the changes in the graph of f(x). x- + bx+2 Complete parts 1 and 2 below. Use the interactive figure to find your answer. Use the left and right arrow keys to move along a slider as needed. Click here to launch the interactive figure. Part 1: What value(s) of b result in a graph with a single hole? b = 3 (Use a comma to separate answers as needed.) Part 2: Using the value found in Part 1, factor the denominator. (Type your answer in factored form.)
Step by Step Solution
There are 3 Steps involved in it
1 Expert Approved Answer
Step: 1 Unlock

Question Has Been Solved by an Expert!
Get step-by-step solutions from verified subject matter experts
Step: 2 Unlock
Step: 3 Unlock