Question: X=70 C) Table 2 shows data collected at UNITEN. Based on Table 2, explained the relationship among the data given. Shows the complete calculation. [14

X=70 X=70 C) Table 2 shows data collected at UNITEN.
C) Table 2 shows data collected at UNITEN. Based on Table 2, explained the relationship among the data given. Shows the complete calculation. [14 marks **(Value of "x" is determined by student unique id range in Table 2) **(You may draw by using excel software. Attach and paste the answer-on-answer sheets) Table 2 Student Interview result Kamal Anis Alya Jasmin Ali Badr Harits Nabiha Student Study (hours) Result exam (%) 60 47 21 40 38 16 40 80 88 75 59 60 50 68 94 Unique ID Bentley Ferrari Jaguar Lexus, Audi 70 60 50 67

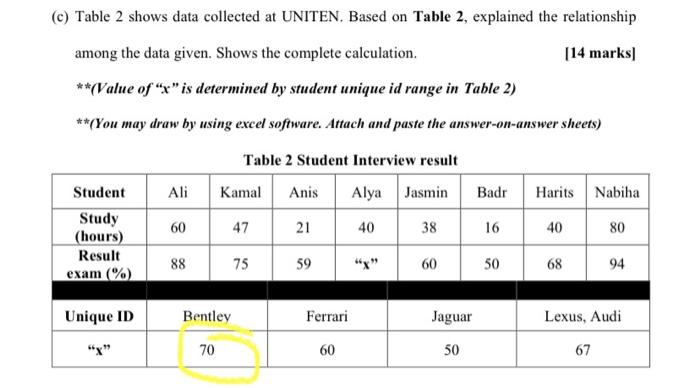
Step by Step Solution

There are 3 Steps involved in it

1 Expert Approved Answer
Step: 1 Unlock blur-text-image
Question Has Been Solved by an Expert!

Get step-by-step solutions from verified subject matter experts

Step: 2 Unlock
Step: 3 Unlock

Students Have Also Explored These Related General Management Questions!