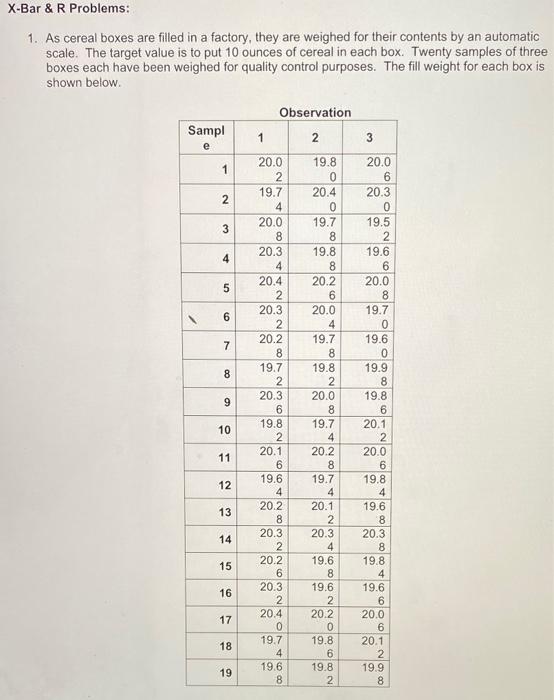
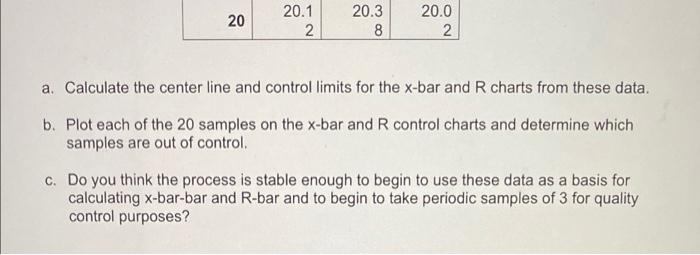
Question: X-Bar & R Problems: 1. As cereal boxes are filled in a factory, they are weighed for their contents by an automatic scale. The target

X-Bar & R Problems: 1. As cereal boxes are filled
X-Bar & R Problems: 1. As cereal boxes are filled in a factory, they are weighed for their contents by an automatic scale. The target value is to put 10 ounces of cereal in each box. Twenty samples of three boxes each have been weighed for quality control purposes. The fill weight for each box is shown below. Sampl Observation 2 1 3 e 1 20.0 1 20.3 N 19.5 3 4 19.6 6 20.0 5 5 19.7 6 7 19.6 19.9 8 19.8 9 20.0 2 19.7 4 20.0 8 20.3 4 20.4 2 20.3 2 20.2 8 19.7 2 20.3 6 19.8 2 20.1 6 19.6 4 20.2 8 20.3 2 20.2 6 20.3 2 20.4 0 19.7 4 19.6 8 19.8 0 20.4 0 19.7 8 19.8 8 20.2 6 20.0 4 19.7 8 19.8 2 20.0 8 19.7 4 20.2 8 19.7 4 20.1 2 20.3 4 19.6 8 19.6 2 20.2 0 19.8 6 19.8 2 OOONO A ON COOOOOOOOOOONOWO 10 20.1 2 20.0 11 19.8 12 13 19.6 14 20.3 19.8 15 16 19.6 6 20.0 17 18 20.1 19.9 19 20 20.1 2 20.3 8 20.0 2. 00 a. Calculate the center line and control limits for the x-bar and R charts from these data. b. Plot each of the 20 samples on the x-bar and R control charts and determine which samples are out of control. c. Do you think the process is stable enough to begin to use these data as a basis for calculating x-bar-bar and R-bar and to begin to take periodic samples of 3 for quality control purposes

Step by Step Solution

There are 3 Steps involved in it

1 Expert Approved Answer
Step: 1 Unlock blur-text-image
Question Has Been Solved by an Expert!

Get step-by-step solutions from verified subject matter experts

Step: 2 Unlock
Step: 3 Unlock

Students Have Also Explored These Related General Management Questions!