

Question: y=1 ......... 10/27 V = sin e Y = cos (0) desmos The dynamic figure shows the graph for each function y = cos(0), y
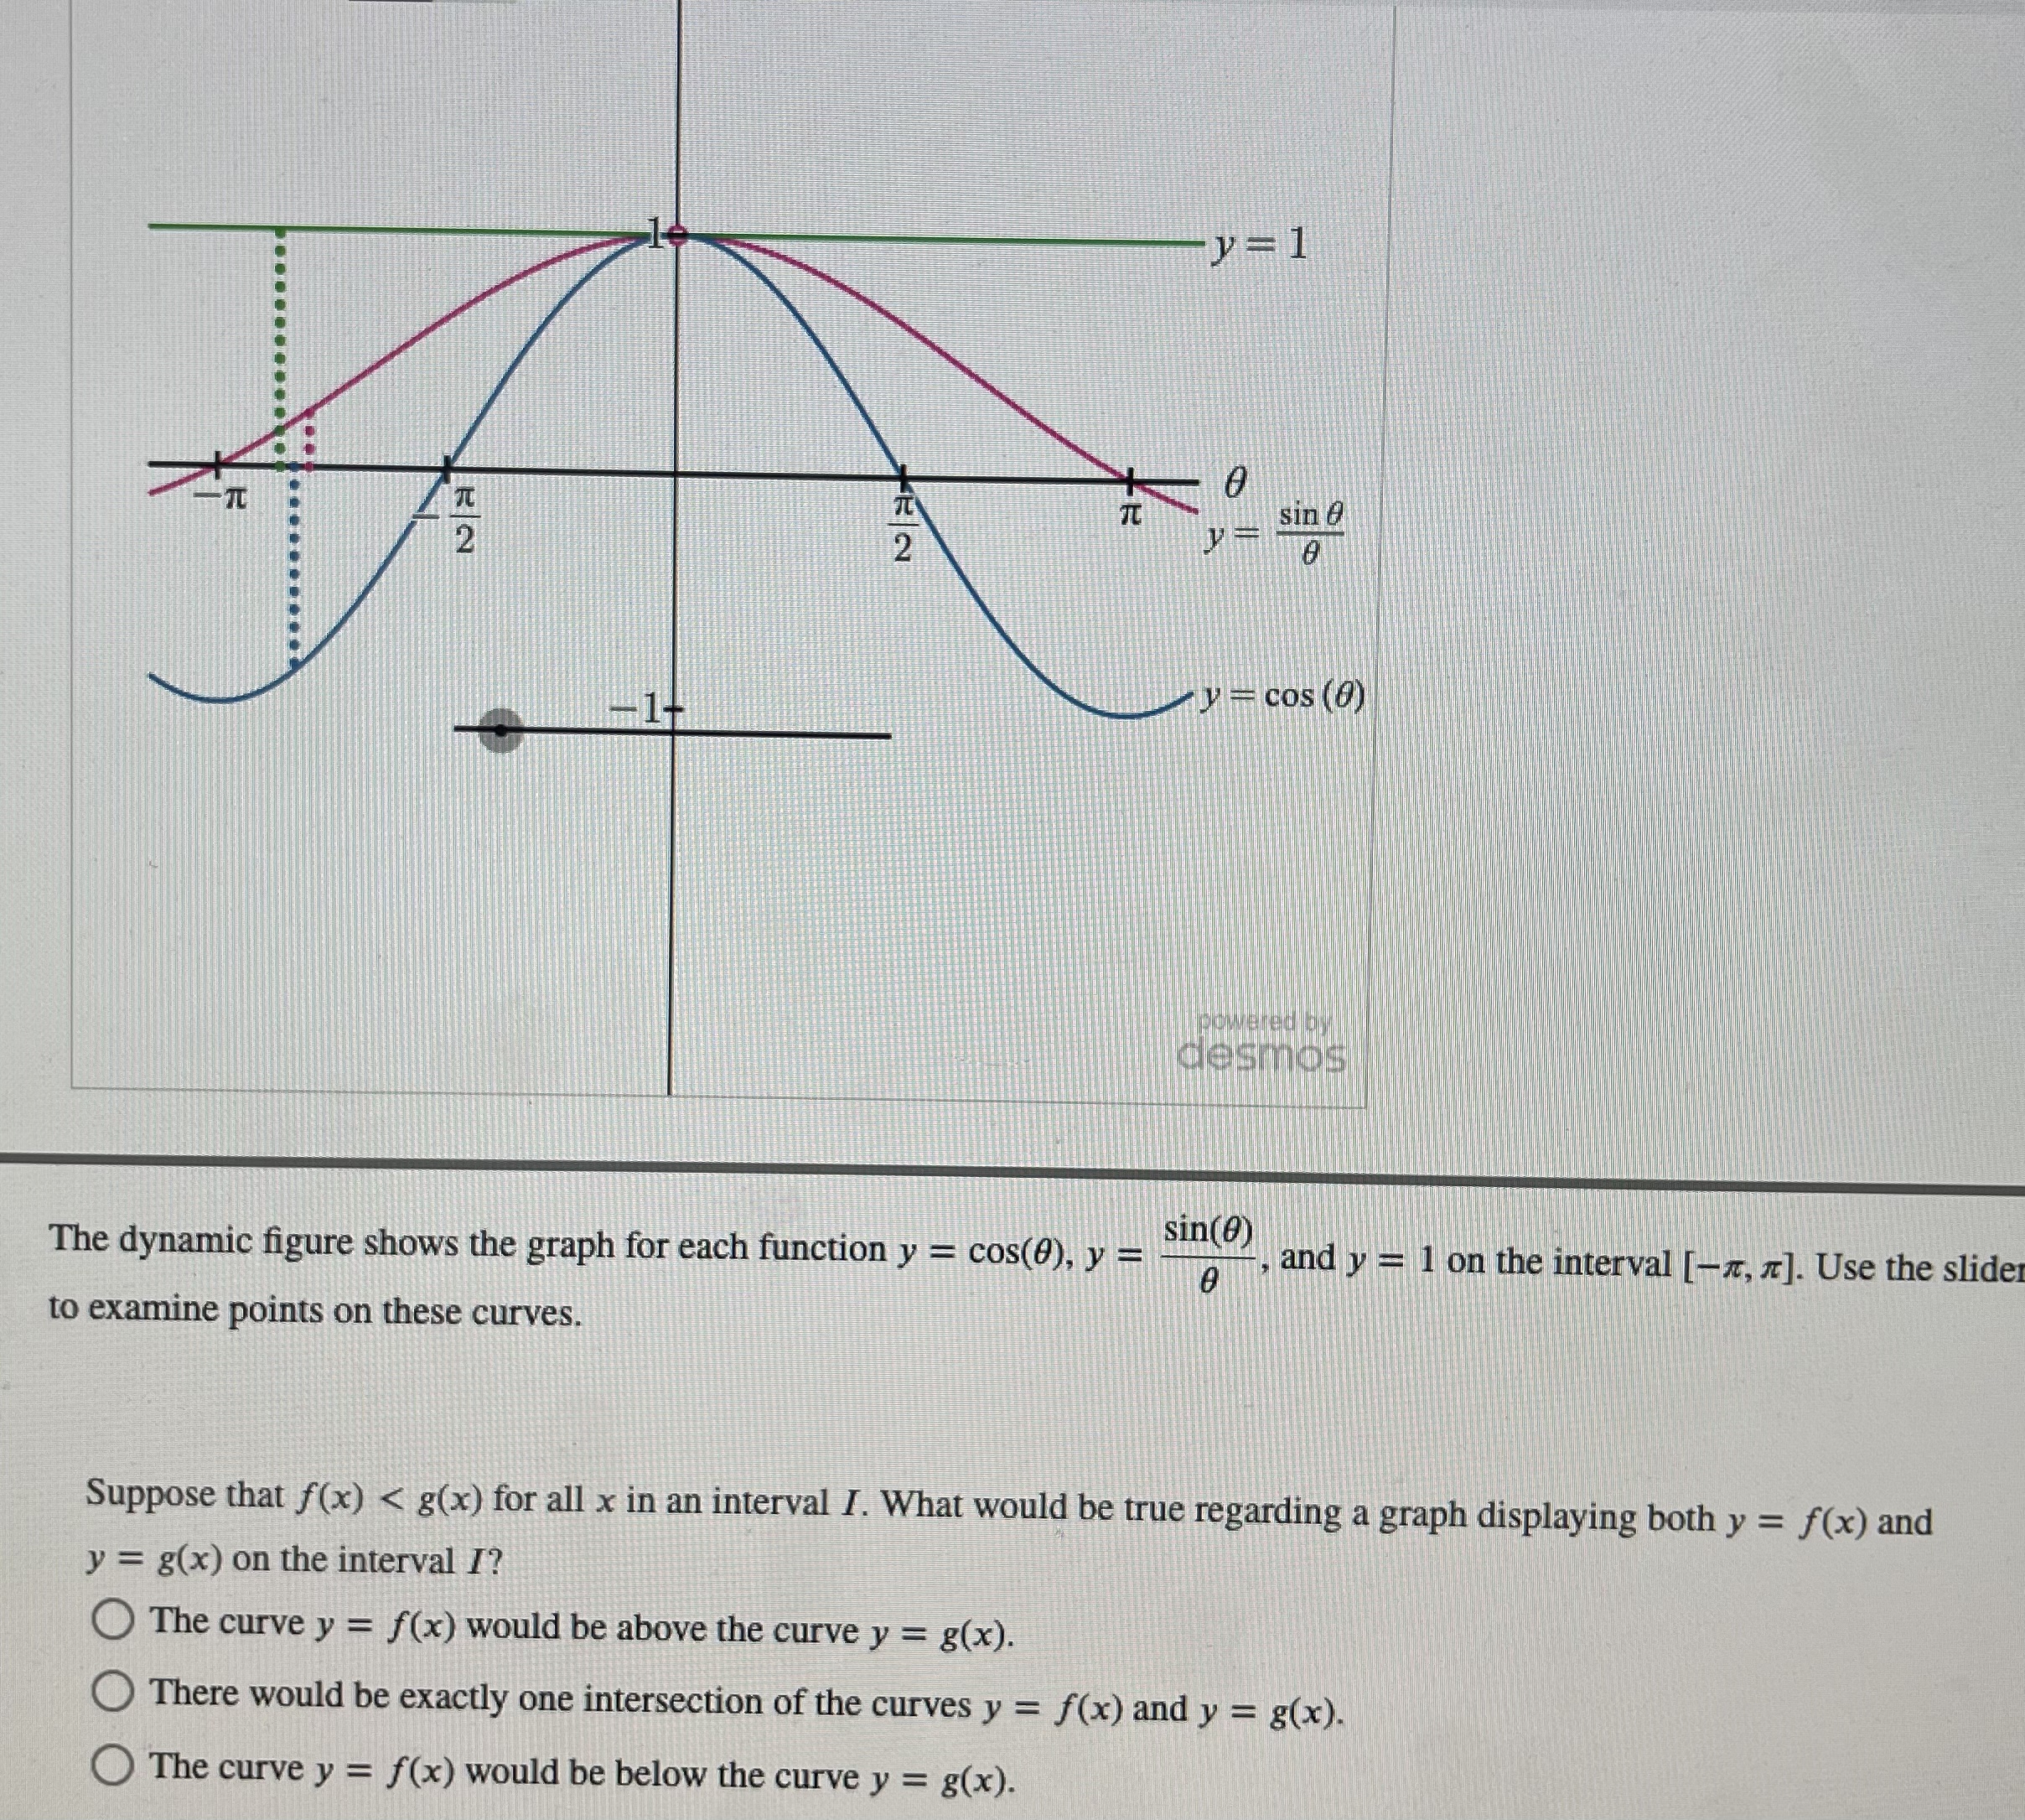

y=1 ......... 10/27 V = sin e Y = cos (0) desmos The dynamic figure shows the graph for each function y = cos(0), y = since) , and y = 1 on the interval [-x, x]. Use the slide to examine points on these curves. Suppose that f(x)
Step by Step Solution
There are 3 Steps involved in it
1 Expert Approved Answer
Step: 1 Unlock

Question Has Been Solved by an Expert!
Get step-by-step solutions from verified subject matter experts
Step: 2 Unlock
Step: 3 Unlock