

Question: Year 1 Year 2 Year 3 Year 4 View on Tableau Public Complete this question by entering your answers in the tabs below. Required 1
Year
Year
Year
Year
View on Tableau Public
Complete this question by entering your answers in the tabs below.
Required A
Required B
Required C
Required
Required
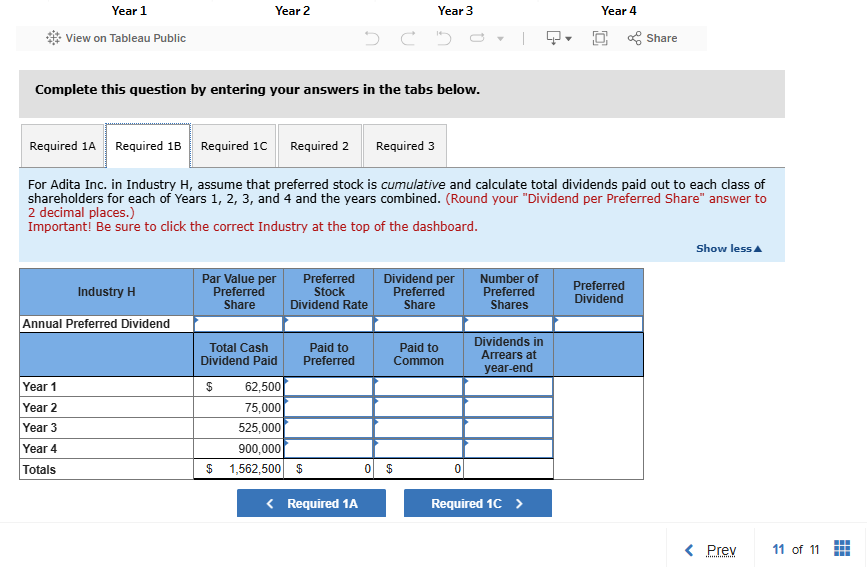
For Adita Inc. in Industry H assume that preferred stock is cumulative and calculate total dividends paid out to each class of shareholders for each of Years and and the years combined. Round your "Dividend per Preferred Share" answer to decimal places.
Important! Be sure to click the correct Industry at the top of the dashboard.
Show less
begintabularcccccc
hline Industry H & Par Value per Preferred Share & Preferred Stock Dividend Rate & Dividend per Preferred Share & Number of Preferred Shares & Preferred Dividend
hline Annual Preferred Dividend & & & & &
hline & Total Cash Dividend Paid & Paid to Preferred & Paid to Common & Dividends in Arrears at yearend &
hline Year & $ & & & &
hline Year & & & & &
hline Year & & & & &
hline Year & & & & &
hline Totals & $ & $ & $ & &
hline
endtabular
of Complete this question by entering your answers in the tabs below.
Required A
Required B
Required C
Required
Required
For Adita Inc. in Industry H assume that preferred stock is cumulative and calculate total dividends paid out to each class of shareholders for each of Years and and the years combined. Round your "Dividend per Preferred Share" answer to decimal places.
Important! Be sure to click the correct Industry at the top of the dashboard.
Show less
begintabularcccccccccc
hline Industry H & Par Value per Preferred Share & multicolumnlPreferred Stock Dividend Rate & multicolumnlDividend per Preferred Share & multicolumnlNumber of Preferred Shares & multicolumnrPreferred Dividend
hline Annual Preferred Dividend & $ & & & $ & & & & $ &
hline & Total Cash Dividend Paid & & id to erred & & & & nds in ars at end & &
hline Year & $ & $ & & $ & & $ & & &
hline Year & & & & & & & & &
hline Year & & & & & & & & &
hline Year & & & & & & & & &
hline Totals & $ & $ & & $ & & & & &
hline
endtabular
Step by Step Solution
There are 3 Steps involved in it
1 Expert Approved Answer
Step: 1 Unlock

Question Has Been Solved by an Expert!
Get step-by-step solutions from verified subject matter experts
Step: 2 Unlock
Step: 3 Unlock