

Question: Year 2004 2005 2006 2007 2008 2009 2010 2011 2012 2013 2014 2015 2016 Exports (thousands 60 kg bag) 10178 10853 10936 11357 11101 7913
Year 2004 2005 2006 2007 2008 2009 2010 2011 2012 2013 2014 2015 2016
Exports (thousands 60 kg bag) 10178 10853 10936 11357 11101 7913 7837 7730 7159 9663 10992 12657 12821
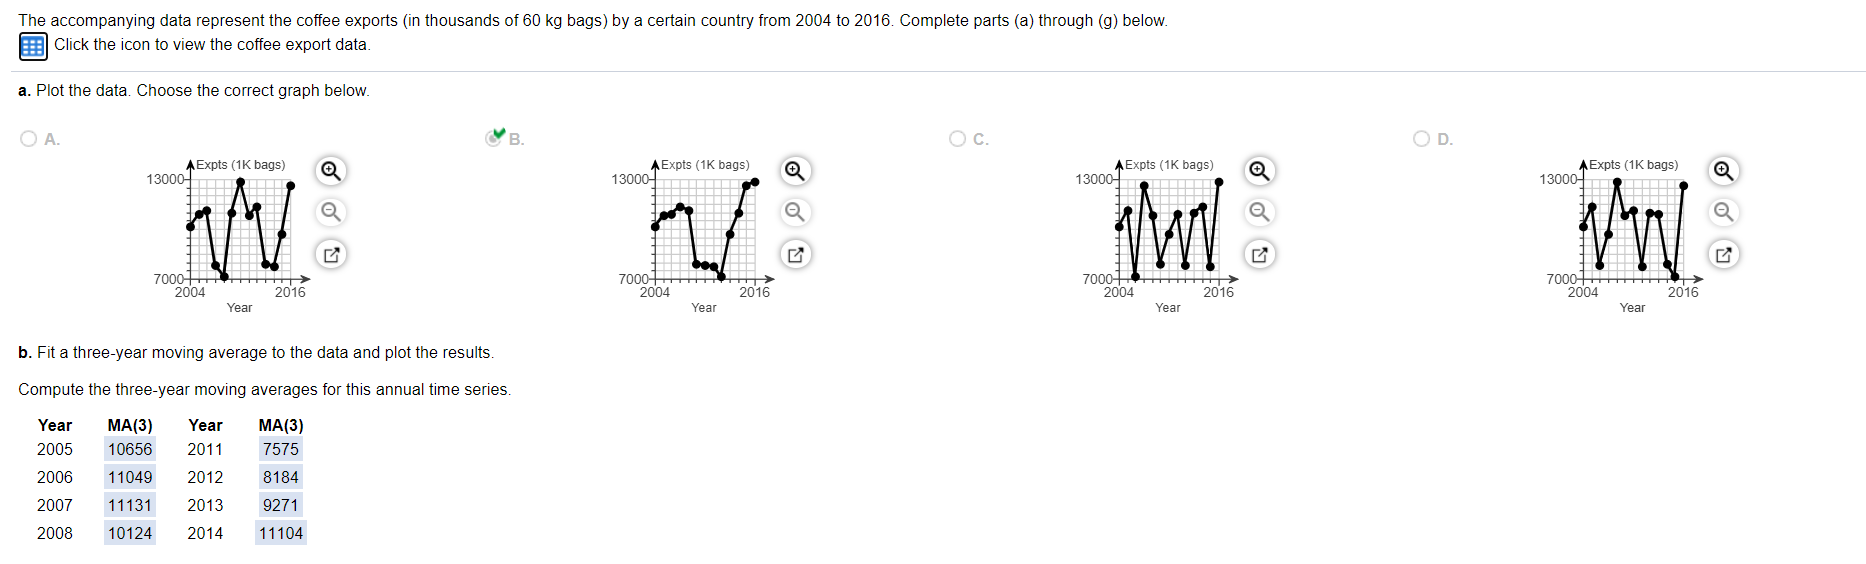
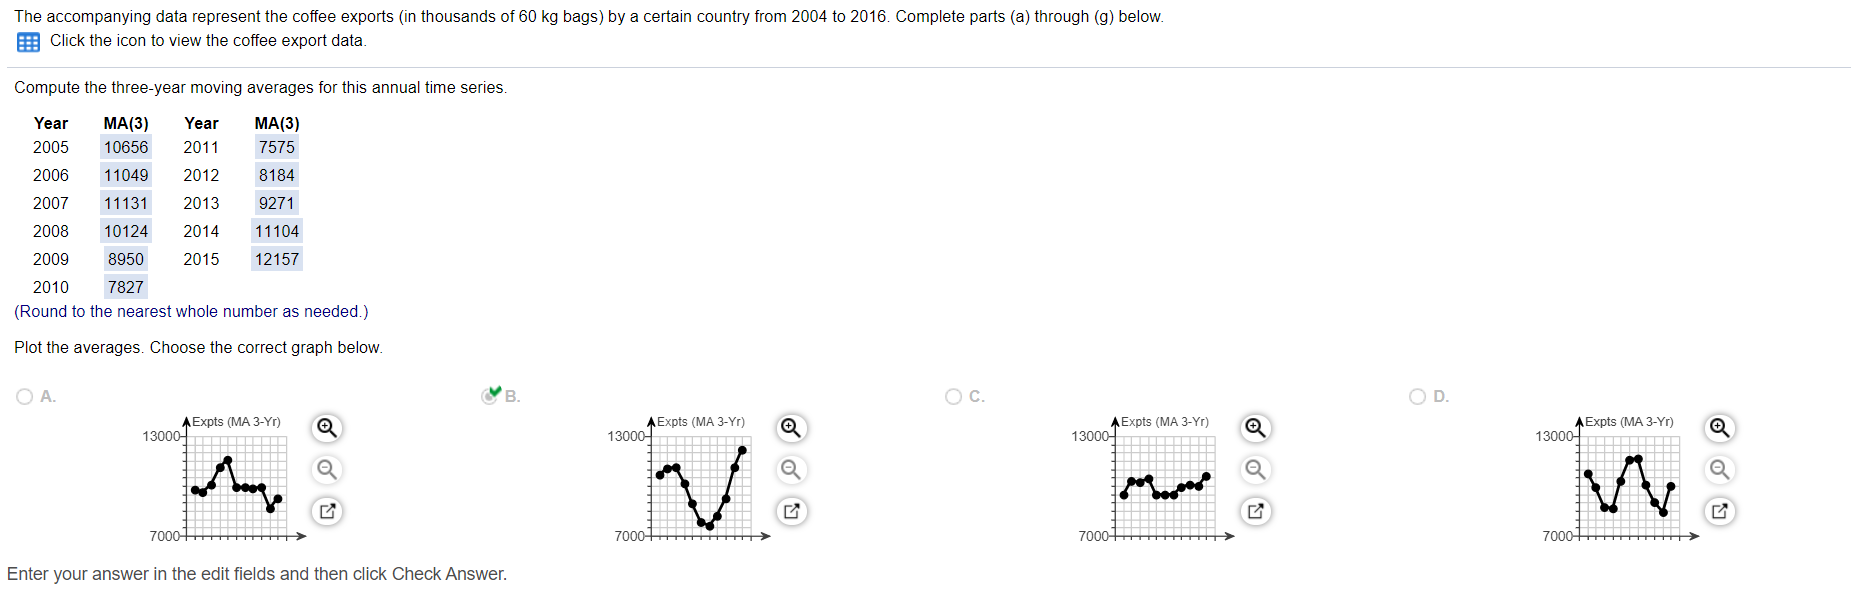
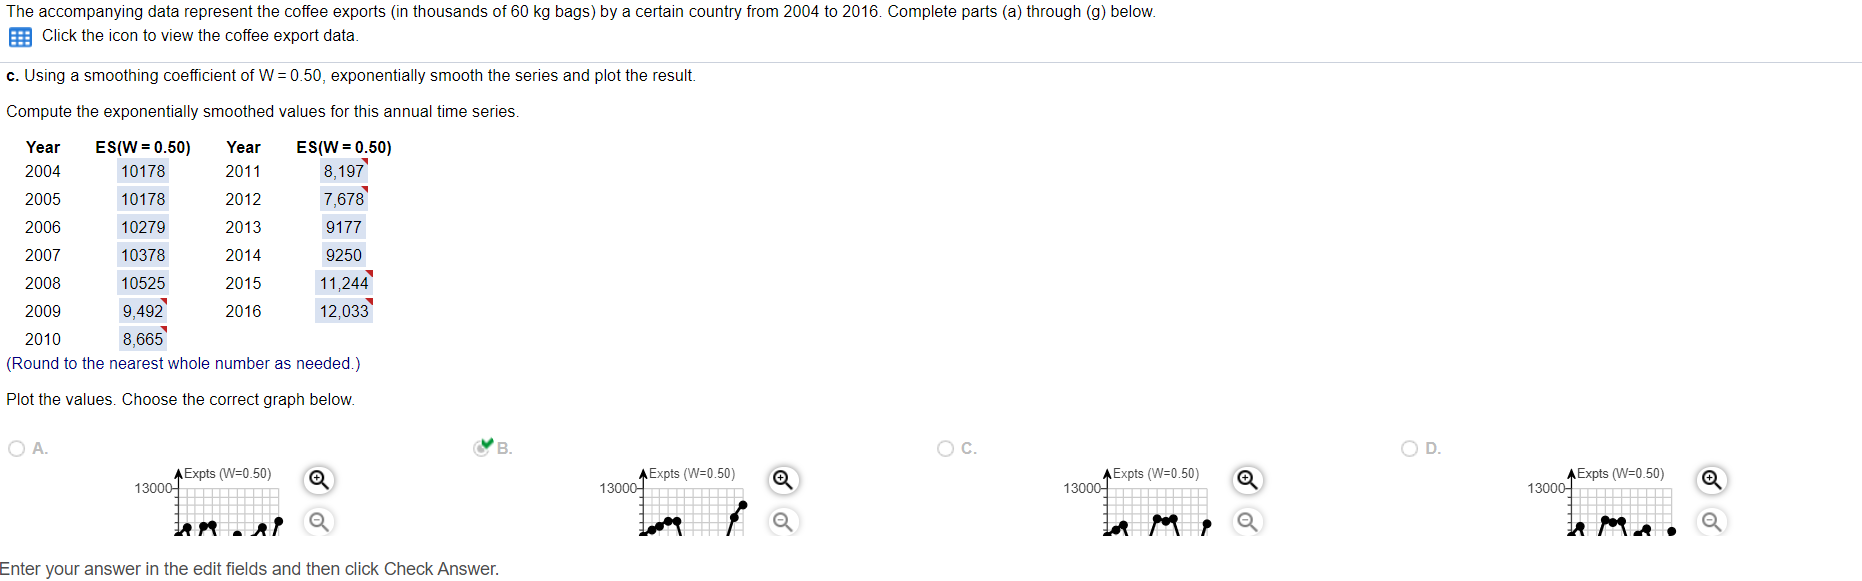
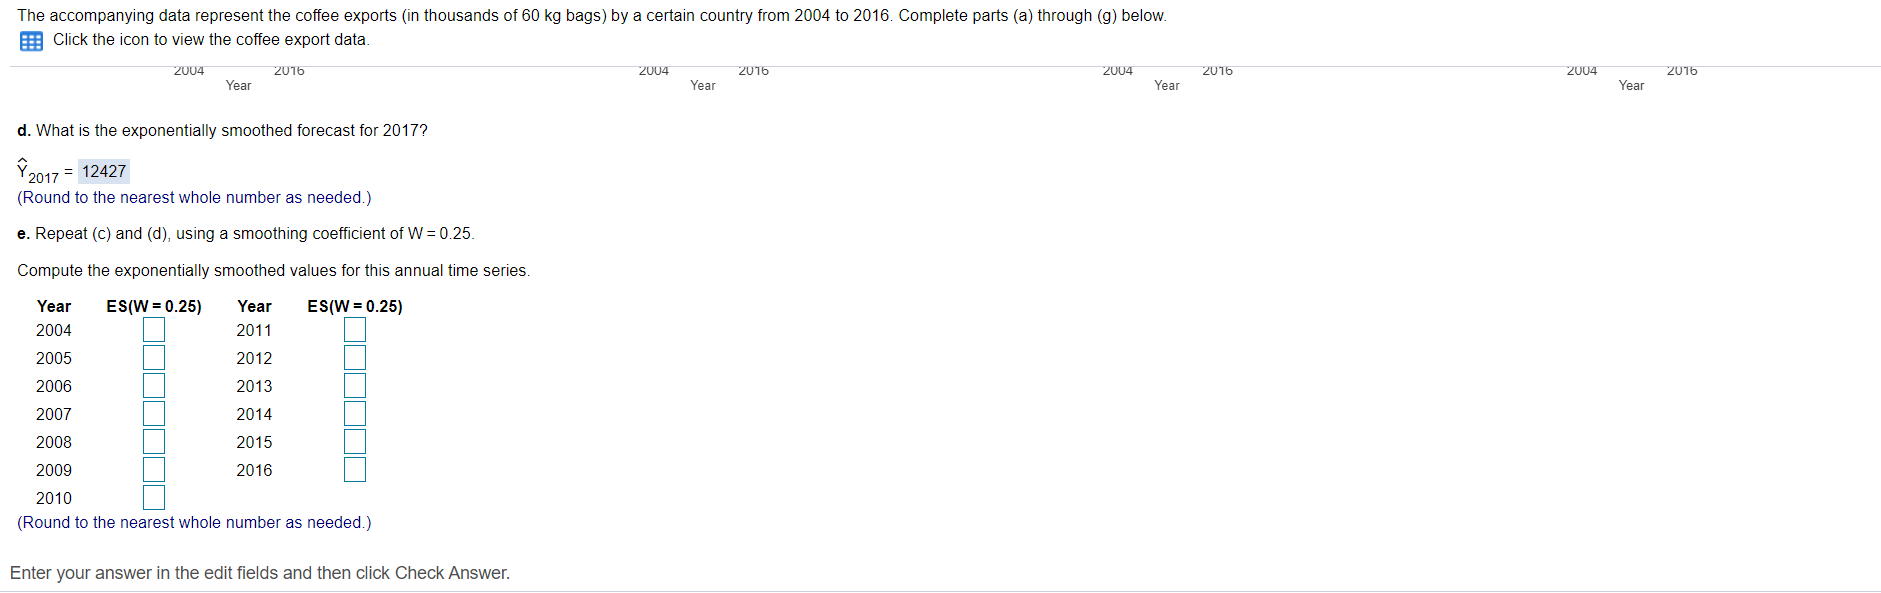
The accompanying data represent the coffee exports (in thousands of 60 kg bags) by a certain country from 2004 to 2016. Complete parts (a) through (9) below. Click the icon to view the coffee export data. a. Plot the data. Choose the correct graph below. O A. B. O c. O D. AExpts (1K bags) AExpts (1K bags) AExpts (1K bags) A Expts (1K bags) 13000- 13000- 13000- C 7000 7000 7000 7000 2004 2016 2004 2016 2004 2016 2004 2016 Year Year Year Year b. Fit a three-year moving average to the data and plot the results. Compute the three-year moving averages for this annual time series. Year MA(3) Year MA(3) 2005 10656 2011 7575 2006 11049 2012 8184 2007 11131 2013 9271 2008 10124 2014 11104The accompanying data represent the coffee exports (in thousands of 60 kg bags) by a certain country from 2004 to 2016. Complete parts (a) through (g) below. Click the icon to view the coffee export data. Compute the three-year moving averages for this annual time series. Year MA(3) Year MA(3) 2005 10656 2011 7575 2006 11049 2012 8184 2007 11131 2013 9271 2008 10124 2014 11 104 2009 8950 2015 12157 2010 7827 (Round to the nearest whole number as needed.) Plot the averages. Choose the correct graph below. O A. B. O c. O D. Expts (MA 3-Yr) A Expts (MA 3-Yr) A Expts (MA 3-Yr) A Expts (MA 3-Yr) 13000- 13000- 13000- 13000- 7000 7000- 7000- 7000 Enter your answer in the edit fields and then click Check Answer.\fThe accompanying data represent the coftee exports (in thousands of 60 kg bags) by a certain country from 2004 to 2016 Complete parts (a) through (9) below a Click the icon to View the coee export data, 2004 101i: zuua 1mm zuua 2m 1:- 2:104 A)\": Year Vea r Year Year 11. What is the exponentially smoothed forecast for 2017') u\" : 12427 (Round to the nearest whole number as needed.) e. Repeat (c) and (d), using a smoothing coefcient ofW: 0 25 Compute the exponentially smoothed values for this annual time series, Year ES(W = 0.25) Year ES(W = 0.25) 2004 2011 2005 2012 2006 2013 2007 2014 2008 2015 2009 2016 2010 (Round t0 the nearest whole number as needed ) Enter your answer in the edit elds and then click Check
Step by Step Solution
There are 3 Steps involved in it

Get step-by-step solutions from verified subject matter experts