

Question: Year Month Demand MA(1) Absolute Deviation MA(4) Absolute Deviation 2018 January 12,354 2018 February 13,657 2018 March 14,536 2018 April 13,478 2018 May 16,590
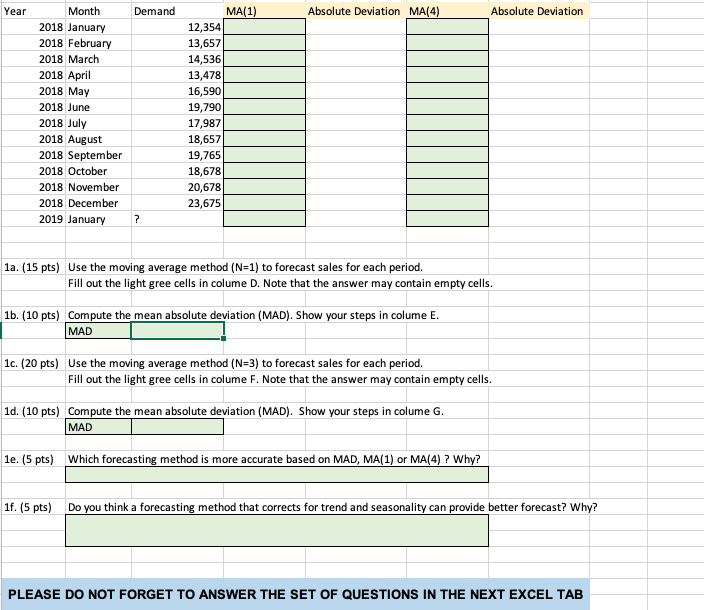
Year Month Demand MA(1) Absolute Deviation MA(4) Absolute Deviation 2018 January 12,354 2018 February 13,657 2018 March 14,536 2018 April 13,478 2018 May 16,590 2018 June 19,790 2018 July 17,987 2018 August 18,657 2018 September 19,765 2018 October 18,678 2018 November 20,678 2018 December 2019 January 23,675 ? 1a. (15 pts) Use the moving average method (N-1) to forecast sales for each period. Fill out the light gree cells in colume D. Note that the answer may contain empty cells. 1b. (10 pts) Compute the mean absolute deviation (MAD). Show your steps in colume E. MAD 1c. (20 pts) Use the moving average method (N=3) to forecast sales for each period. Fill out the light gree cells in colume F. Note that the answer may contain empty cells. 1d. (10 pts) Compute the mean absolute deviation (MAD). Show your steps in colume G. MAD 1e. (5 pts) Which forecasting method is more accurate based on MAD, MA(1) or MA(4)? Why? 1f. (5 pts) Do you think a forecasting method that corrects for trend and seasonality can provide better forecast? Why? PLEASE DO NOT FORGET TO ANSWER THE SET OF QUESTIONS IN THE NEXT EXCEL TAB
Step by Step Solution
There are 3 Steps involved in it

Get step-by-step solutions from verified subject matter experts