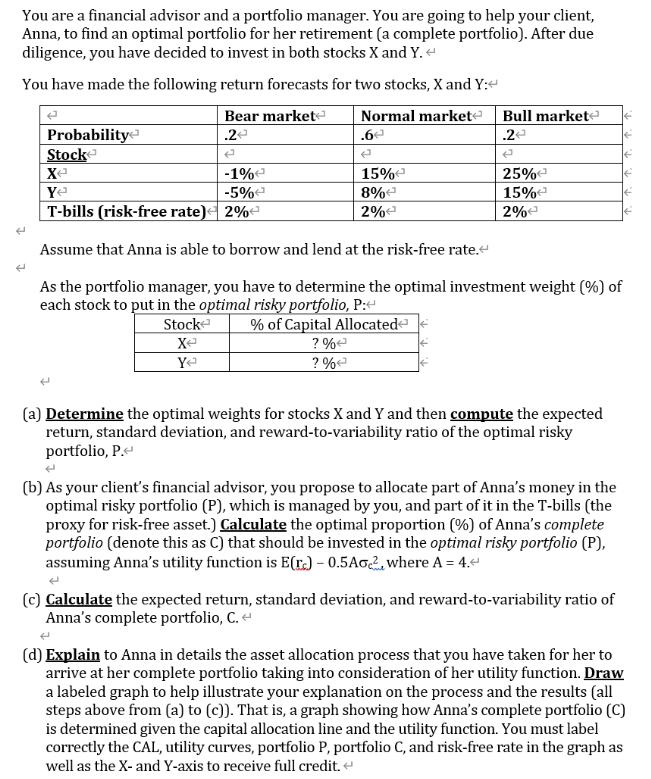
You are a financial advisor and a portfolio manager. You are going to help your client,...
Fantastic news! We've Found the answer you've been seeking!
Question:
Transcribed Image Text:
You are a financial advisor and a portfolio manager. You are going to help your client, Anna, to find an optimal portfolio for her retirement (a complete portfolio). After due diligence, you have decided to invest in both stocks X and Y.< You have made the following return forecasts for two stocks, X and Y: Probability Stock Xe Ye Bear market .2 Normal market .6 P Bull markete .2 P -1% 15% -5% 8% T-bills (risk-free rate) 2% 2% Assume that Anna is able to borrow and lend at the risk-free rate.< As the portfolio manager, you have to determine the optimal investment weight (%) of each stock to put in the optimal risky portfolio, P: Stock % of Capital Allocated Xe ? % ?%< Ye 25% 15% 2% (a) Determine the optimal weights for stocks X and Y and then compute the expected return, standard deviation, and reward-to-variability ratio of the optimal risky portfolio, P. (b) As your client's financial advisor, you propose to allocate part of Anna's money in the optimal risky portfolio (P), which is managed by you, and part of it in the T-bills (the proxy for risk-free asset.) Calculate the optimal proportion (%) of Anna's complete portfolio (denote this as C) that should be invested in the optimal risky portfolio (P), assuming Anna's utility function is E(r.) - 0.5A02, where A = 4.< (c) Calculate the expected return, standard deviation, and reward-to-variability ratio of Anna's complete portfolio, C. < (d) Explain to Anna in details the asset allocation process that you have taken for her to arrive at her complete portfolio taking into consideration of her utility function. Draw a labeled graph to help illustrate your explanation on the process and the results (all steps above from (a) to (c)). That is, a graph showing how Anna's complete portfolio (C) is determined given the capital allocation line and the utility function. You must label correctly the CAL, utility curves, portfolio P, portfolio C, and risk-free rate in the graph as well as the X- and Y-axis to receive full credit. You are a financial advisor and a portfolio manager. You are going to help your client, Anna, to find an optimal portfolio for her retirement (a complete portfolio). After due diligence, you have decided to invest in both stocks X and Y.< You have made the following return forecasts for two stocks, X and Y: Probability Stock Xe Ye Bear market .2 Normal market .6 P Bull markete .2 P -1% 15% -5% 8% T-bills (risk-free rate) 2% 2% Assume that Anna is able to borrow and lend at the risk-free rate.< As the portfolio manager, you have to determine the optimal investment weight (%) of each stock to put in the optimal risky portfolio, P: Stock % of Capital Allocated Xe ? % ?%< Ye 25% 15% 2% (a) Determine the optimal weights for stocks X and Y and then compute the expected return, standard deviation, and reward-to-variability ratio of the optimal risky portfolio, P. (b) As your client's financial advisor, you propose to allocate part of Anna's money in the optimal risky portfolio (P), which is managed by you, and part of it in the T-bills (the proxy for risk-free asset.) Calculate the optimal proportion (%) of Anna's complete portfolio (denote this as C) that should be invested in the optimal risky portfolio (P), assuming Anna's utility function is E(r.) - 0.5A02, where A = 4.< (c) Calculate the expected return, standard deviation, and reward-to-variability ratio of Anna's complete portfolio, C. < (d) Explain to Anna in details the asset allocation process that you have taken for her to arrive at her complete portfolio taking into consideration of her utility function. Draw a labeled graph to help illustrate your explanation on the process and the results (all steps above from (a) to (c)). That is, a graph showing how Anna's complete portfolio (C) is determined given the capital allocation line and the utility function. You must label correctly the CAL, utility curves, portfolio P, portfolio C, and risk-free rate in the graph as well as the X- and Y-axis to receive full credit.
Expert Answer:
Answer rating: 100% (QA)
a To find the optimal weights we set up the optimization problem Maximize ErP 05AP2 Subject to wX wY ... View the full answer
Related Book For
Introduction To Corporate Finance
ISBN: 9781118300763
3rd Edition
Authors: Laurence Booth, Sean Cleary
Posted Date:
Students also viewed these finance questions
-
KYC's stock price can go up by 15 percent every year, or down by 10 percent. Both outcomes are equally likely. The risk free rate is 5 percent, and the current stock price of KYC is 100. (a) Price a...
-
You are a financial advisor and one of your clients comes to you with a convertible bond that has a coupon rate of 8 percent. The market interest rate is 6 percent. The share price of the company...
-
Planning is one of the most important management functions in any business. A front office managers first step in planning should involve determine the departments goals. Planning also includes...
-
The figure shows a rotating wheel with radius 40 cm and a connecting rod AP with length 1.2 m. The pin P slides back and forth along the -axis as the wheel rotates counterclockwise at a rate of 360...
-
The following are comparative financial statements of the Perez Company for 2006, 2007, and 2008: Required On the basis of the given information: 1. Prepare horizontal analyses for Perez Company...
-
We had illustrated that rotations in three dimensions are non-commutative or non-Abelian through the example of rotating a coffee cup about two orthogonal axes in two different orders. While a very...
-
Visit www.pearsonglobaleditions.com/malhotra to read the video case and view the accompanying video. Subaru: Mr. Survey Monitors Customer Satisfaction presents an interesting overview of Joe...
-
The following balance sheet for the Hubbard Corporation was prepared by the company: Additional information: 1. The buildings, land, and machinery are all stated at cost except for a parcel of land...
-
Joint Cost Allocation Net Realizable Value Method Nature s Garden Inc. produces wood chips, wood pulp, and mulch. These products are produced through harvesting trees and sending the logs through a...
-
Pistol Corporation acquired 70 percent of Scope Corporations voting stock on May 18, 20X1. The companies reported the following data with respect to intercompany sales in 20X4 and 20X5: Pistol...
-
Compare and contrast corporate image advertising and corporate issue advertising, and provide an example of each.
-
On January 1 of Year One, Grant Inc. issued a total of 2,000 shares of $1 par, restricted common stock to five executives. The fair value of the shares of stock on January 1is $300,000. The...
-
Given the parametric equations Compute the derivative dy/dxa as a function of t. Answer: x = 2t-t, y = 3-5t
-
During an audit, an auditor calculates the amount of depreciation and agrees the amount to the client's fixed asset continuity schedule. This evidence-gathering procedure is called Select answer from...
-
You just purchased a share of SPCC for $101. You expect to receive a dividend of $5 in one year. If you expect the price after the dividend is paid to be $114, what total return will you have earned...
-
1. Discuss the importance of assigning passwords and rights to users of an electronic health record (EHR) system. 2. Explain why it is important to lock an EHR system when not actively working with...
-
The table below gives the number of suicides estimated in the U.S. for a recent year by age, race (black or white), and sex. We are interested in possible relationships between age, race, and sex. We...
-
A fast-food restaurant averages 150 customers per hour. The average processing time per customer is 90 seconds. a. Determine how many cash registers the restaurant should have if it wishes to...
-
What are the practical difficulties when attempting to apply the NPV evaluation process to foreign investments?
-
a. If the firm is not capital constrained and the projects in Table 1 are mutually exclusive, which project should the firm undertake using the following criteria? i. NPV ii. IRR iii. Payback period...
-
What is the difference between sensitivity analysis and scenario analysis?
-
Study Figure 13.6. Write a short report on Bayers management of its cash flows over the period reported. Figure 13.6 Bayer Group's consolidated statement of cash flows Income after taxes Income taxes...
-
Expenses and revenues are subjective; cash flows are facts. Therefore cash flow statements cannot mislead. Discuss.
-
Repeat Exercise 13.3, but this time work on the assumption that non-current assets that had originally cost :30,000, with accumulated depreciation of :12,000, had been sold during the year ended 31...
Study smarter with the SolutionInn App