

You are an investor who is considering adding Chem-Med to your portfolio. As such, you are...
Fantastic news! We've Found the answer you've been seeking!
Question:
Transcribed Image Text:
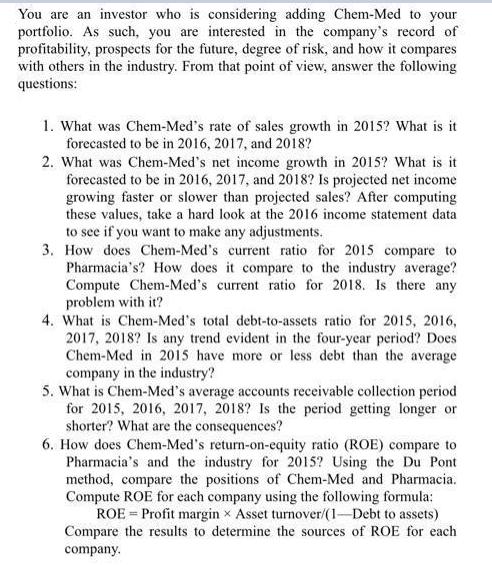
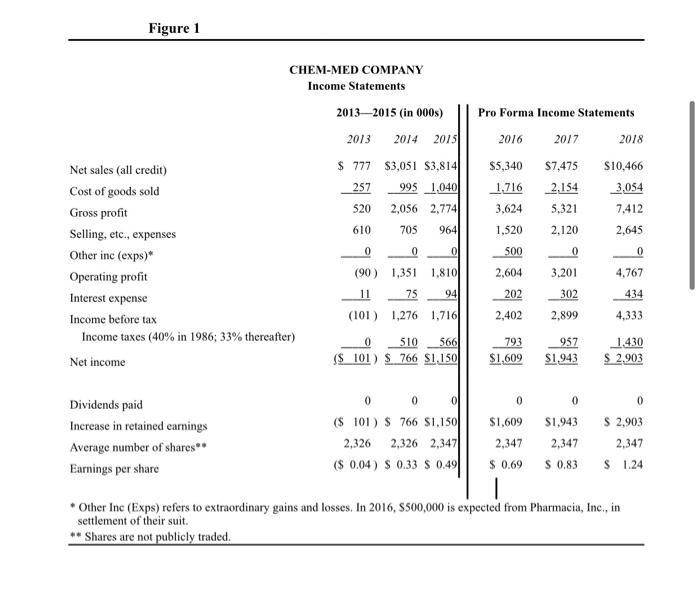
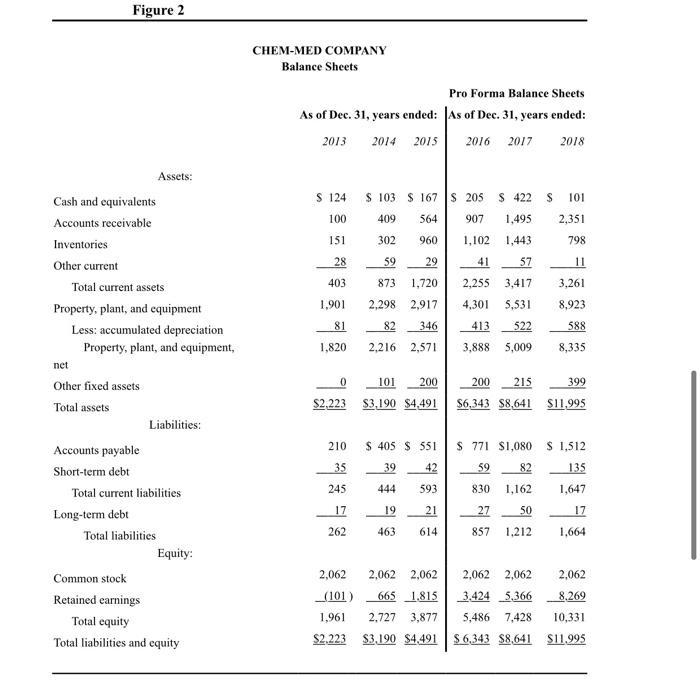
You are an investor who is considering adding Chem-Med to your portfolio. As such, you are interested in the company's record of profitability, prospects for the future, degree of risk, and how it compares with others in the industry. From that point of view, answer the following questions: 1. What was Chem-Med's rate of sales growth in 2015? What is it forecasted to be in 2016, 2017, and 2018? 2. What was Chem-Med's net income growth in 2015? What is it forecasted to be in 2016, 2017, and 2018? Is projected net income growing faster or slower than projected sales? After computing these values, take a hard look at the 2016 income statement data to see if you want to make any adjustments. 3. How does Chem-Med's current ratio for 2015 compare to Pharmacia's? How does it compare to the industry average? Compute Chem-Med's current ratio for 2018. Is there any problem with it? 4. What is Chem-Med's total debt-to-assets ratio for 2015, 2016, 2017, 2018? Is any trend evident in the four-year period? Does Chem-Med in 2015 have more or less debt than the average company in the industry? 5. What is Chem-Med's average accounts receivable collection period for 2015, 2016, 2017, 2018? Is the period getting longer or shorter? What are the consequences? 6. How does Chem-Med's return-on-equity ratio (ROE) compare to Pharmacia's and the industry for 2015? Using the Du Pont method, compare the positions of Chem-Med and Pharmacia. Compute ROE for each company using the following formula: ROE Profit margin Asset turnover/(1-Debt to assets) Compare the results to determine the sources of ROE for each company. = Figure 1 CHEM-MED COMPANY Income Statements 2013-2015 (in 000s) Pro Forma Income Statements. 2013 2014 2015 2016 2017 2018 $5,340 $ 777 $3,051 $3,814 $7,475 Net sales (all credit) $10,466 257 995 1,040 1,716 2,154 Cost of goods sold 3,054 520 2,056 2,774 3,624 5,321 7,412 Gross profit 610 705 Selling, etc., expenses 964 1,520 2,120 2,645 0 Other inc (exps)* 0 0 500 0 0 1,351 1,810 2,604 3,201 4,767 Operating profit (90) 11 (101) 1,276 1,716 75 94 202 302 434 Interest expense 2,402 2,899 4,333 Income before tax Income taxes (40% in 1986; 33% thereafter) 510 566 793 957 1,430 0 ($ 101) $ 766 $1,150 Net income $1,609 $1,943 $ 2.903 0 0 0 0 0 0 Dividends paid Increase in retained earnings ($ 101) $ 766 $1,150 2,326 2,326 2,347 $1,609 2,347 S 0.83 $1,943 2,347 $ 2,903 2,347 Average number of shares** $ 0.69 ($ 0.04) $ 0.33 $ 0.49 Earnings per share $ 1.24 * Other Inc (Exps) refers to extraordinary gains and losses. In 2016, $500,000 is expected from Pharmacia, Inc., in settlement of their suit. **Shares are not publicly traded. Figure 2 Assets: Cash and equivalents Accounts receivable Inventories Other current Total current assets Property, plant, and equipment Less: accumulated depreciation Property, plant, and equipment, Liabilities: net Other fixed assets Total assets Accounts payable Short-term debt Total current liabilities Long-term debt Total liabilities Equity: Common stock Retained earnings Total equity Total liabilities and equity CHEM-MED COMPANY Balance Sheets Pro Forma Balance Sheets As of Dec. 31, years ended: 2014 2015 2016 2017 2018 $ 103 $167 $ 205 S422 S 101 409 564 907 1,495 2,351 302 960 1,102 1,443 798 28 59 29 41 57 11 873 1,720 2,255 3,417 3,261 403 1,901 81 4,301 5,531 8,923 2,298 2,917 82 346 2,216 2,571 413 522 588 1,820 3,888 5,009 8,335 0 200 215 399 200 101 $3,190 $4,491 $2,223 $6,343 $8,641 $11,995 210 $ 405 $ 551 S 771 $1,080 $ 1,512 35 39 42 59 82 135 245 444 593 830 1,162 1,647 17 19 21 27 50 17 262 463 614 857 1,212 1,664 2,062 2,062 2,062 2,062 2,062 2,062 665 1.815 3.424 5,366 8,269 (101) 1,961 2,727 3,877 5,486 7,428 10,331 $2,223 $3,190 $4,491 $6,343 $8,641 $11.995 As of Dec. 31, years ended: 2013 S 124 100 151 Figure 3 Biotechnology Industry Statistics Median Company in SIC 2831 Biological Products* 2013 2014 2015 2.5 2.3 2.4 Current ratio Quick ratio 1.2 1.1 1.3 Inventory turnover 5.5 5.6 5.7 Total asset turnover 1.16 1.18 Return on sales 4.00% 5.00% Return on assets 4.64$ 5.90% Return on equity 8.44% 12.29% Total debt to assets 0.45 0.52 Selected Statistics Pharmacia Company 2013 2014 2015 Current ratio 2.8 2.7 2.8 Quick ratio 1.5 1.3 1.6 Inventory turnover 5.6 5.7 5.8 Total asset turnover 1.9 2 1.9 Return on sales 6.00% 6.50% 7.00% Return on assets 11.40% 13.00% 13.30% Return on equity 19.04% 27.66% 29.56% Total debt to assets 0.40 0.53 0.55 Price-earnings ratio 13.7 14 15 Average stock price $21.78 $24.92 $31.50 * Source: Dun's Industry Ratios. The data have been adjusted for this case. 1.15 4.00% 4.60% 7.64% 0.40 You are an investor who is considering adding Chem-Med to your portfolio. As such, you are interested in the company's record of profitability, prospects for the future, degree of risk, and how it compares with others in the industry. From that point of view, answer the following questions: 1. What was Chem-Med's rate of sales growth in 2015? What is it forecasted to be in 2016, 2017, and 2018? 2. What was Chem-Med's net income growth in 2015? What is it forecasted to be in 2016, 2017, and 2018? Is projected net income growing faster or slower than projected sales? After computing these values, take a hard look at the 2016 income statement data to see if you want to make any adjustments. 3. How does Chem-Med's current ratio for 2015 compare to Pharmacia's? How does it compare to the industry average? Compute Chem-Med's current ratio for 2018. Is there any problem with it? 4. What is Chem-Med's total debt-to-assets ratio for 2015, 2016, 2017, 2018? Is any trend evident in the four-year period? Does Chem-Med in 2015 have more or less debt than the average company in the industry? 5. What is Chem-Med's average accounts receivable collection period for 2015, 2016, 2017, 2018? Is the period getting longer or shorter? What are the consequences? 6. How does Chem-Med's return-on-equity ratio (ROE) compare to Pharmacia's and the industry for 2015? Using the Du Pont method, compare the positions of Chem-Med and Pharmacia. Compute ROE for each company using the following formula: ROE Profit margin Asset turnover/(1-Debt to assets) Compare the results to determine the sources of ROE for each company. = Figure 1 CHEM-MED COMPANY Income Statements 2013-2015 (in 000s) Pro Forma Income Statements. 2013 2014 2015 2016 2017 2018 $5,340 $ 777 $3,051 $3,814 $7,475 Net sales (all credit) $10,466 257 995 1,040 1,716 2,154 Cost of goods sold 3,054 520 2,056 2,774 3,624 5,321 7,412 Gross profit 610 705 Selling, etc., expenses 964 1,520 2,120 2,645 0 Other inc (exps)* 0 0 500 0 0 1,351 1,810 2,604 3,201 4,767 Operating profit (90) 11 (101) 1,276 1,716 75 94 202 302 434 Interest expense 2,402 2,899 4,333 Income before tax Income taxes (40% in 1986; 33% thereafter) 510 566 793 957 1,430 0 ($ 101) $ 766 $1,150 Net income $1,609 $1,943 $ 2.903 0 0 0 0 0 0 Dividends paid Increase in retained earnings ($ 101) $ 766 $1,150 2,326 2,326 2,347 $1,609 2,347 S 0.83 $1,943 2,347 $ 2,903 2,347 Average number of shares** $ 0.69 ($ 0.04) $ 0.33 $ 0.49 Earnings per share $ 1.24 * Other Inc (Exps) refers to extraordinary gains and losses. In 2016, $500,000 is expected from Pharmacia, Inc., in settlement of their suit. **Shares are not publicly traded. Figure 2 Assets: Cash and equivalents Accounts receivable Inventories Other current Total current assets Property, plant, and equipment Less: accumulated depreciation Property, plant, and equipment, Liabilities: net Other fixed assets Total assets Accounts payable Short-term debt Total current liabilities Long-term debt Total liabilities Equity: Common stock Retained earnings Total equity Total liabilities and equity CHEM-MED COMPANY Balance Sheets Pro Forma Balance Sheets As of Dec. 31, years ended: 2014 2015 2016 2017 2018 $ 103 $167 $ 205 S422 S 101 409 564 907 1,495 2,351 302 960 1,102 1,443 798 28 59 29 41 57 11 873 1,720 2,255 3,417 3,261 403 1,901 81 4,301 5,531 8,923 2,298 2,917 82 346 2,216 2,571 413 522 588 1,820 3,888 5,009 8,335 0 200 215 399 200 101 $3,190 $4,491 $2,223 $6,343 $8,641 $11,995 210 $ 405 $ 551 S 771 $1,080 $ 1,512 35 39 42 59 82 135 245 444 593 830 1,162 1,647 17 19 21 27 50 17 262 463 614 857 1,212 1,664 2,062 2,062 2,062 2,062 2,062 2,062 665 1.815 3.424 5,366 8,269 (101) 1,961 2,727 3,877 5,486 7,428 10,331 $2,223 $3,190 $4,491 $6,343 $8,641 $11.995 As of Dec. 31, years ended: 2013 S 124 100 151 Figure 3 Biotechnology Industry Statistics Median Company in SIC 2831 Biological Products* 2013 2014 2015 2.5 2.3 2.4 Current ratio Quick ratio 1.2 1.1 1.3 Inventory turnover 5.5 5.6 5.7 Total asset turnover 1.16 1.18 Return on sales 4.00% 5.00% Return on assets 4.64$ 5.90% Return on equity 8.44% 12.29% Total debt to assets 0.45 0.52 Selected Statistics Pharmacia Company 2013 2014 2015 Current ratio 2.8 2.7 2.8 Quick ratio 1.5 1.3 1.6 Inventory turnover 5.6 5.7 5.8 Total asset turnover 1.9 2 1.9 Return on sales 6.00% 6.50% 7.00% Return on assets 11.40% 13.00% 13.30% Return on equity 19.04% 27.66% 29.56% Total debt to assets 0.40 0.53 0.55 Price-earnings ratio 13.7 14 15 Average stock price $21.78 $24.92 $31.50 * Source: Dun's Industry Ratios. The data have been adjusted for this case. 1.15 4.00% 4.60% 7.64% 0.40
Expert Answer:
Answer rating: 100% (QA)
Part A Chem Meds Sales Growth Increase in Sales for the year 2015 3814 3051 763 Growth in 2015 763 3051 X 100 25 Expected Increase in Sales of 2016 5340 3814 1526 Expected Growth in 2016 1526 3814 X 1... View the full answer

Related Book For 
Canadian Income Taxation planning and decision making
ISBN: 9781259094330
17th edition 2014-2015 version
Authors: Joan Kitunen, William Buckwold
Posted Date:
Students also viewed these accounting questions
-
You are an investor who is looking for a place to invest your money. Previous investments have led you to feel that you are only interested in public, unregulated companies. You must choose a company...
-
An investor who is an individual could earn a 10% return either from shares that pay a low dividend and have high growth or from shares that pay a high dividend and have low growth. Assuming that the...
-
What are the trade-offs facing an investor who is considering buying a put option on an existing portfolio?
-
Alexa owns a condominium near Cocoa Beach in Florida. In 2022, she incurs the following expenses in connection with her condo: Insurance $ 3,900 Mortgage interest 10,700 Property taxes 3,000 Repairs...
-
A retaining wall 5 ft high is constructed of horizontal wood planks 3 in. thick (actual dimension) that are supported by vertical wood piles of 12 in. diameter (actual dimension), as shown in the...
-
ABC Company employs a periodic inventory system and sells its inventory to customers for $25 per unit. ABC Company had the following inventory information available for the month of May: May 1...
-
Social Jetlag Social jetlag refers to the difference between circadian and social clocks, and is measured as the difference in sleep and wake times between work days and free days. For example, if...
-
Pat Colt is auditing the financial statements of Manning Company. The following is a summary of the uncorrected misstatements that Colt has identified during the last three years. These misstatements...
-
4.4. Solve the problem Ju + uu = 0 (u(x, 0) = g(x) where g(x) = 1 0 TER, t> 0 TER x <0 0 1.
-
Mark Make-a-Buck sells jars of beach sand in Florida. His price per jar is $2.50. His historical costs have been: $.40 per item $.10 per item $.30 per item $.20 per item $500 per month $1,000 per...
-
Fitzsimmons & Fitzsimmons (2008) compare 2 capacity management strategies. Part of their comparison is presented below: Customer waiting Labour skill level Forecasting Capacity plan: Level Capacity...
-
Problem 8 (10 points). For each of the following methods, determine its big-O characterization in terms of n. A. public static int exampleA (int [ ] arr) { 2 int narr.length, total = 0; Ca public...
-
Iterating Over a Collection Iterating a method over a collection of objects is a common task that you may complete unknowingly each day. Within a collection of similar things, you identify the...
-
Can you describe: 1. Distributed bus arbitration using self selection with pros and cons. 2. Daisy chain arbitration with pros and cons. 3. Centralized parallel bus arbitration with pros and cons. 4....
-
Write two versions of the following class: The first version is a regular class where the class name is Data. The class have one instance variable called msg of type string, and one static/class...
-
Identify and discuss two or three ways that a Christian view of change is similar to that of a cognitive behavioral approach. Support your position with references to the videos or reading. Based on...
-
Compensating a flexible workforce is an emerging trend and there has been a growing debate about how you do it since the pandemic. This is because flexible work scheduling is an opportunity to...
-
Subprime loans have higher loss rates than many other types of loans. Explain why lenders offer subprime loans. Describe the characteristics of the typical borrower in a subprime consumer loan.
-
Andy Marcus is the sole shareholder of Marcus Ltd., a Canadian-controlled private corporation. The common shares of Marcus Ltd. have a fair market value of $300,000, an ACB of $50,000, and a PUC of...
-
How are the net capital losses and non-capital losses of a corporation affected when voting control of the corporation shifts from one shareholder to another?
-
Carol received salary of $60,000 during the current year. In addition she earned commission income of $25,000 of which she received $15,000 in the current year. She received the remaining $10,000 in...
-
A gene is a segment of DNA that contains the information to produce a functional product. The functional product of most genes is a. DNA. b. mRNA. c. a polypeptide. d. none of the above.
-
Which of the following is not a constituent of a cells proteome? a. An enzyme b. A cytoskeletal protein c. A transport protein in the plasma membrane d. An mRNA
-
The function of the genetic code is to a. promote transcription. b. specify the amino acids within a polypeptide. c. alter the sequence of DNA. d. do none of the above.

Study smarter with the SolutionInn App