

Question: You are asked to do the following: Develop your own MATLAB m-file (script or functional) for the following 1-D optimization methods: Golden-section search method Parabolic
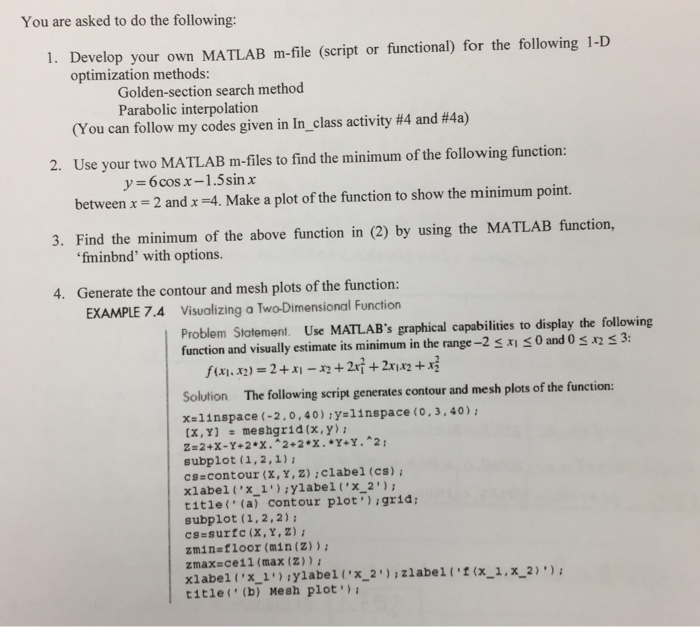
You are asked to do the following: Develop your own MATLAB m-file (script or functional) for the following 1-D optimization methods: Golden-section search method Parabolic interpolation (You can follow my codes given in In_class activity #4 and #4a) Use your two MATLAB m-files to find the minimum of the following function: y = 6cos x - 1.5sin x between x = 2 and x = 4. Make a plot of the function to show the minimum point. Find the minimum of the above function in (2) by using the MATLAB function 'fminbnd' with options. Generate the contour and mesh plots of the function: Visualizing a Two-Dimensional Function Problem Statement Use MATLAB's graphical capabilities to display the following function and visually estimate its minimum in the range -2 lessthanorequalto x_1 lessthanorequalto 0 and 0 lessthanorequalto x_2 lessthanorequalto 3: f(x_1, x_2) = 2 + x_1 - x_2 + 2x_1^2 + 2x_1 x_2 + x_2^2 Solution The following script generates contour and mesh plots of the function: x = linspace (-2, 0, 40): y = linspace (0, 3, 40) [X, Y] = meshgrid(x, y): Z=2+X-Y*2*X. ^2+2*X.*Y+Y.a^2: subplot(1, 2, 1): c =contour(X, Y, Z), -clabel(cs): xlabel ('x_1'), ;ylabel (x_2'): title ('(a) contour plot ');grid: subplot(1, 2, 2): cs=surface(X, Y, Z): zmin =floor (min(z)): z max = ceil (max(z)): xlabel ('x_1'): ylabel ('x_2'): zlabel ('f(x_1, x_2)'): title
Step by Step Solution
There are 3 Steps involved in it

Get step-by-step solutions from verified subject matter experts