

Question: You are asked to generate a scatterplot using python . You are given a text file with these columns (4 continuous columns and 1 categorical
You are asked to generate a scatterplot using python.
You are given a text file with these columns (4 continuous columns and 1 categorical column); you can presume that this textfile works as a well-formed data frame. The script must incorporate a command-line intergace using such options:
- Path to input file
- 1-based index of column containing continuous x and y values
- 1-based index of column containing categorical series values
- Path to output file
Q. Generate two scatterploits: 1) Two columns of continuous data and 2) a third column of categrocial class column is used. In the second scatterplot, a separate series of doys added to the plot fot each categorical data.
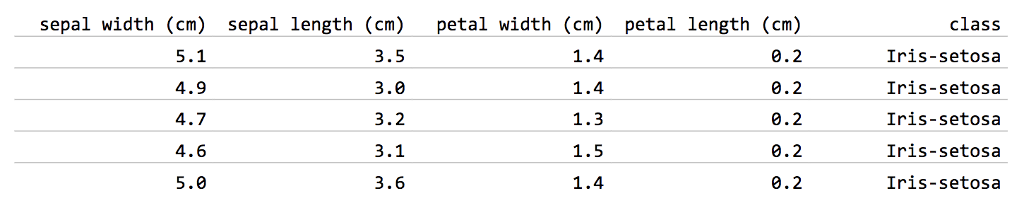
sepal width (cm) sepal length (cm) petal width (cm) petal length (cm) 0.2 0.2 0.2 0.2 .2 3.5 3.0 3.2 3.1 3.6 class Iris-setosa Iris-setosa Iris-setosa Iris-setosa Iris-setosa 1.4 4.9 4.7 4.6 5.0 1.4 1.5 1.4 sepal width (cm) sepal length (cm) petal width (cm) petal length (cm) 0.2 0.2 0.2 0.2 .2 3.5 3.0 3.2 3.1 3.6 class Iris-setosa Iris-setosa Iris-setosa Iris-setosa Iris-setosa 1.4 4.9 4.7 4.6 5.0 1.4 1.5 1.4
Step by Step Solution
There are 3 Steps involved in it

Get step-by-step solutions from verified subject matter experts