

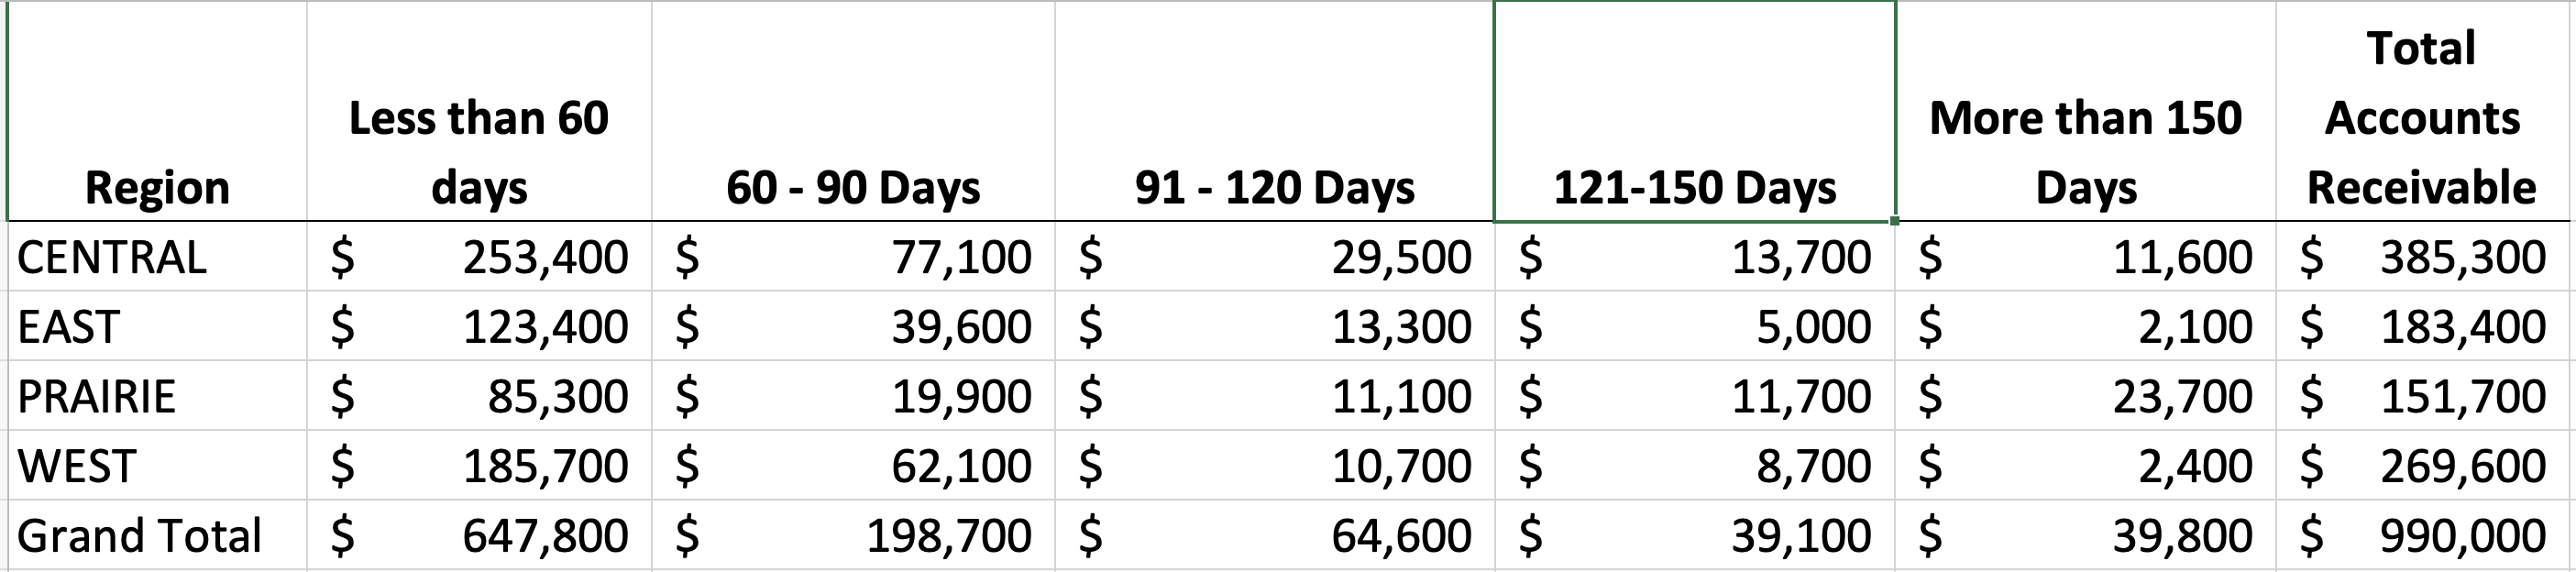
Question: You are asked to prepare a visualization that illustrates the total amount of loans by region and the age of receivables. Use the provided data
You are asked to prepare a visualization that illustrates the total amount of loans by region and the age of receivables. Use the provided data to prepared a stacked column chart. thank you for any help suggestions Region Less than days Days Days Days More than Days Total Accounts Receivable CENTRAL $ $ $ $ $ $ EAST $ $ $ $ $ PRAIRIE $ $ $ $ $ WEST $ $ $ $ $ Grand Total $ $ $ $ $
Step by Step Solution
There are 3 Steps involved in it
1 Expert Approved Answer
Step: 1 Unlock

Question Has Been Solved by an Expert!
Get step-by-step solutions from verified subject matter experts
Step: 2 Unlock
Step: 3 Unlock