

Question: You are developing an X-bar chart based on sample means. You know the average range is 4, the sample size is 15, and the average
You are developing an X-bar chart based on sample means. You know the average range is 4, the sample size is 15, and the average of the sample means is 20. Which of the following is your LCL? exhibit 13.7 O 19.12 Number of Observations each sample O 20.88 2 3 12 16 Link to the pdf version of the table or for Determining from R the Three-Sigma Control Limits X- and R-Charts Q Search X-Chart A 1.88 1.02 0.73 0.58 0.48 0.42 0.37 0.34 0.31 0.29 0.27 0.25 0.24 0.22 0.1 Factors for R-Chart Lower Control Limit D 0 0 0 0 0.08 0.14 0.18 0.22 0.26 0.28 0.31 0.33 0.35 0.36 0.38 Upper Control Limit D 3.27 2.57 2.28 2.11 2.00 1.92 1.86 1.82 1.78 1.74 1.72 1.69 1.67 1.65 1.64 1.62 Employee 18
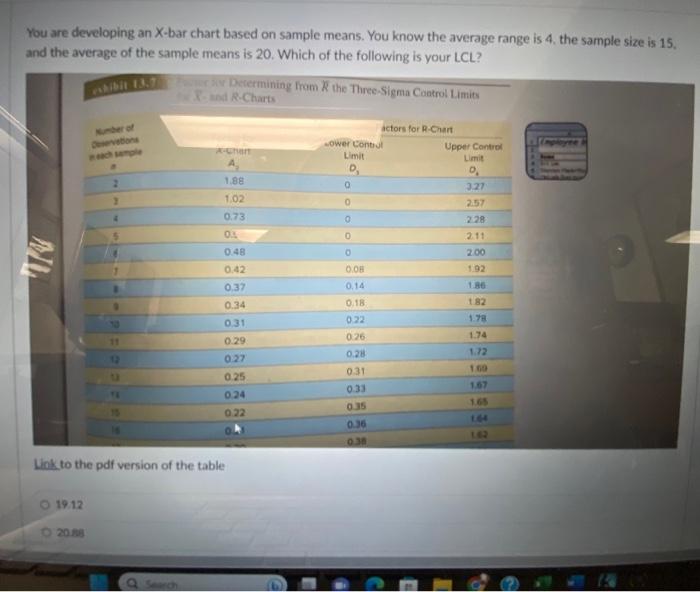
You are developing an X-bar chart based on sample means. You know the average range is 4 , the sample size is 15 , and the average of the sample means is 20 . Which of the following is your LCL
Step by Step Solution
There are 3 Steps involved in it
1 Expert Approved Answer
Step: 1 Unlock

Question Has Been Solved by an Expert!
Get step-by-step solutions from verified subject matter experts
Step: 2 Unlock
Step: 3 Unlock