

Question: You are examining a data set with an expanded stem-and-leaf plot. (Hint: Look at the plot n:arefull1_l..r.why.r are there two # signs?} The plot has


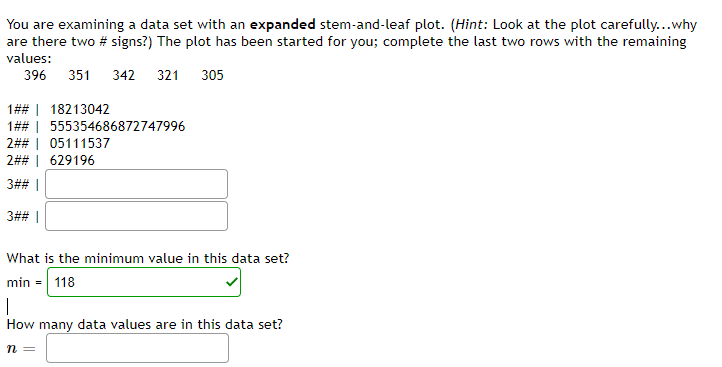
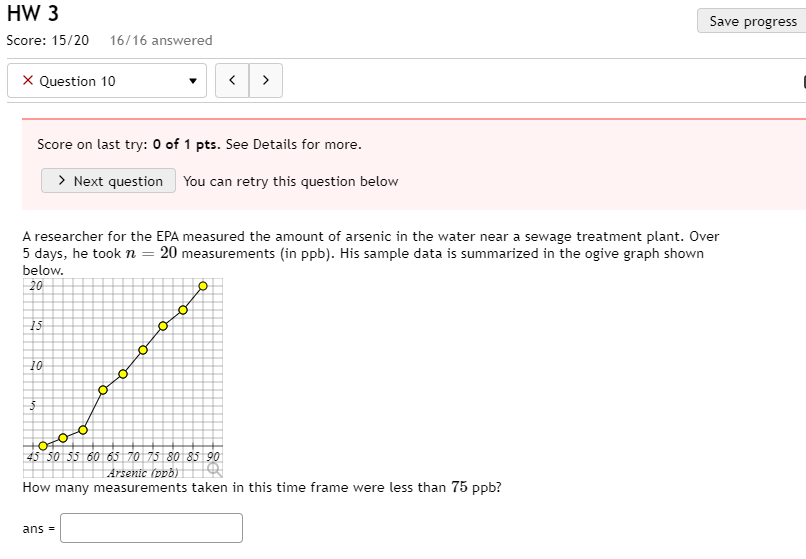
You are examining a data set with an expanded stem-and-leaf plot. (Hint: Look at the plot n:arefull1_l..r.\"why.r are there two # signs?} The plot has been started for you; complete the last two rows with the remaining values: 3% 351 342 321 EDS 1## | 182131142 1## | 555354638HT4TQQ 211135? | 051 11 53? 2## | 629196 W I W I What is the minimum value in this data set? How many.r data values are in this data set? R: HW 3 Save progress Score: 15/20 16/16 answered X Question 10 Score on last try: 0 of 1 pts. See Details for more. > Next question You can retry this question below A researcher for the EPA measured the amount of arsenic in the water near a sewage treatment plant. Over 5 days, he took n = 20 measurements (in ppb). His sample data is summarized in the ogive graph shown below. 20 15 O 45 50 35 60 65 70 75 80 85 90 Arsenic (pob) How many measurements taken in this time frame were less than 75 ppb? ans =
Step by Step Solution
There are 3 Steps involved in it

Get step-by-step solutions from verified subject matter experts