

Question: You are given a hardness graph (HV) for a welded metal. Explain the relationship between the hardness values and the possible microstructures you can
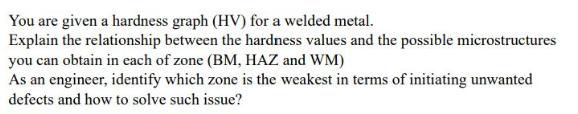
You are given a hardness graph (HV) for a welded metal. Explain the relationship between the hardness values and the possible microstructures you can obtain in each of zone (BM, HAZ and WM) As an engineer, identify which zone is the weakest in terms of initiating unwanted defects and how to solve such issue? Hv9.8N 300 250 200 W.M. -2 ...::3 F.L. 2 3 HAZ 7 8 9 10 11 12 13 14 15 16 456 Labo. seam weld (J1) Base metal: X100 19.1mmt Weld heat input: 3.0kJ/mm 8 10 12 2 4 Position (mm) B.M. 16 6 14 1mm Ave.Hv of BM: 253 Min. Hv in HAZ: 211 (83% of BM) A Hv: 42 8 10
Step by Step Solution
3.43 Rating (162 Votes )
There are 3 Steps involved in it
Step 1 of 2 a Relationship between hardness values and possible microstructures in each zone Base metal BM The BM has the highest hardness typically around 250HV for X100 steel This is because the BM ... View full answer

Get step-by-step solutions from verified subject matter experts