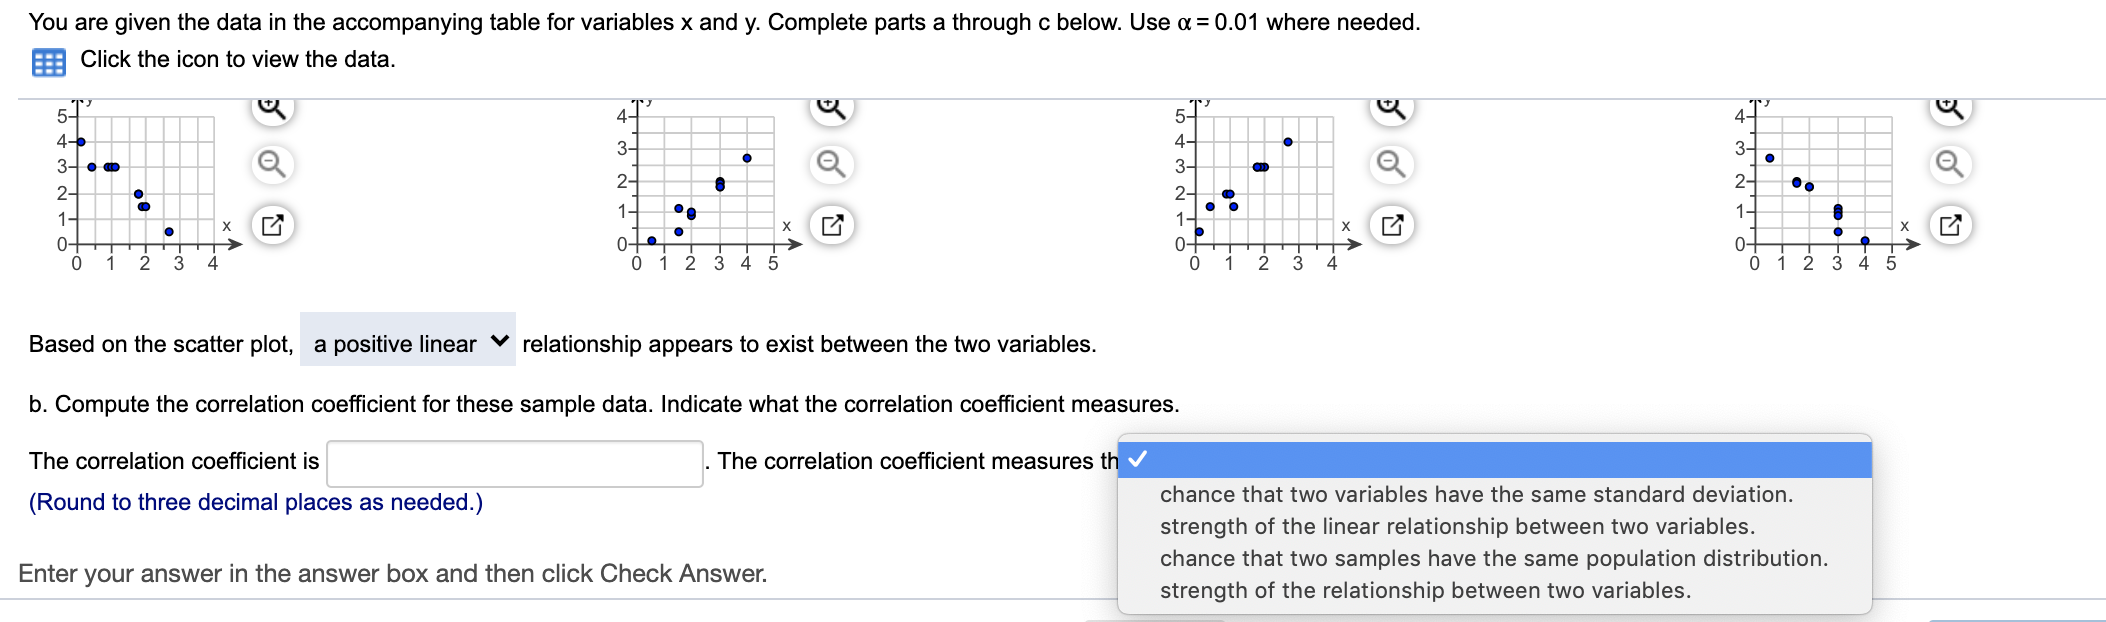
Question: You are given the data in the accompanying table for variables x and y. Complete parts a through c below. Use a = 0.01 where

You are given the data in the accompanying table

You are given the data in the accompanying table for variables x and y. Complete parts a through c below. Use a = 0.01 where needed. Click the icon to view the data. 57" 4- 47' 3- 3- 0 2- 4-6 34. O 2- 1- 0- 0 1 4- 3- 2- 1- . 2- 1- 1- . X X 0 0+. 0 1 2 3 4 2 3 4 0 1 2 0 1 3 4 5 Based on the scatter plot, a positive linear v relationship appears to exist between the two variables. b. Compute the correlation coefficient for these sample data. Indicate what the correlation coefficient measures. The correlation coefficient is The correlation coefficient measures th (Round to three decimal places as needed.) chance that two variables have the same standard deviation. strength of the linear relationship between two variables. chance that two samples have the same population distribution. strength of the relationship between two variables. Enter your answer in the answer box and then click Check

Step by Step Solution

There are 3 Steps involved in it

1 Expert Approved Answer
Step: 1 Unlock blur-text-image
Question Has Been Solved by an Expert!

Get step-by-step solutions from verified subject matter experts

Step: 2 Unlock
Step: 3 Unlock

Students Have Also Explored These Related General Management Questions!