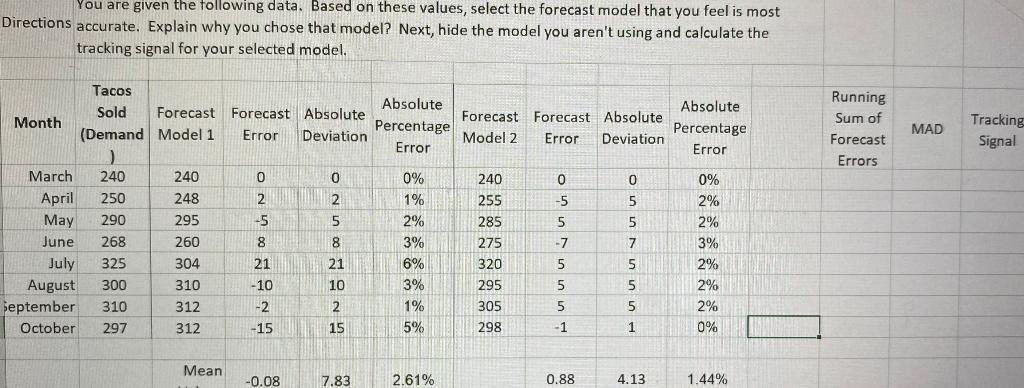
Question: You are given the following data. Based on these values, select the forecast model that you feel is most Directions accurate. Explain why you chose

You are given the following data. Based on these

You are given the following data. Based on these values, select the forecast model that you feel is most Directions accurate. Explain why you chose that model? Next, hide the model you aren't using and calculate the tracking signal for your selected model. Forecast Forecast Absolute Model 2 Error Deviation Absolute Percentage Error Running Sum of Forecast Errors MAD Tracking Signal 0 0 -5 5 Tacos Sold Forecast forecast Absolute Absolute Month Percentage (Demand Model 1 Error Deviation Error ) March 240 240 0 0 0% April 250 248 2 2 1% May 290 295 -5 5 2% 268 260 8 8 3% July 325 304 21 21 6% August 300 310 -10 10 3% September 310 312 -2 2 1% October 297 -15 15 5% 5 5 June -7 7 240 255 285 275 320 295 305 298 0% 2% 2% 3% 2% 2% 2% 0% 5 5 5 5 5 5 312 -1 1 Mean -0.08 7.83 2.61% 0.88 4.13 1.44%

Step by Step Solution

There are 3 Steps involved in it

1 Expert Approved Answer
Step: 1 Unlock blur-text-image
Question Has Been Solved by an Expert!

Get step-by-step solutions from verified subject matter experts

Step: 2 Unlock
Step: 3 Unlock

Students Have Also Explored These Related General Management Questions!