

Question: You are given the following statistical output in Table 1, a study on a Robust optimization approach for the capacitated vehicle routing problem with demand
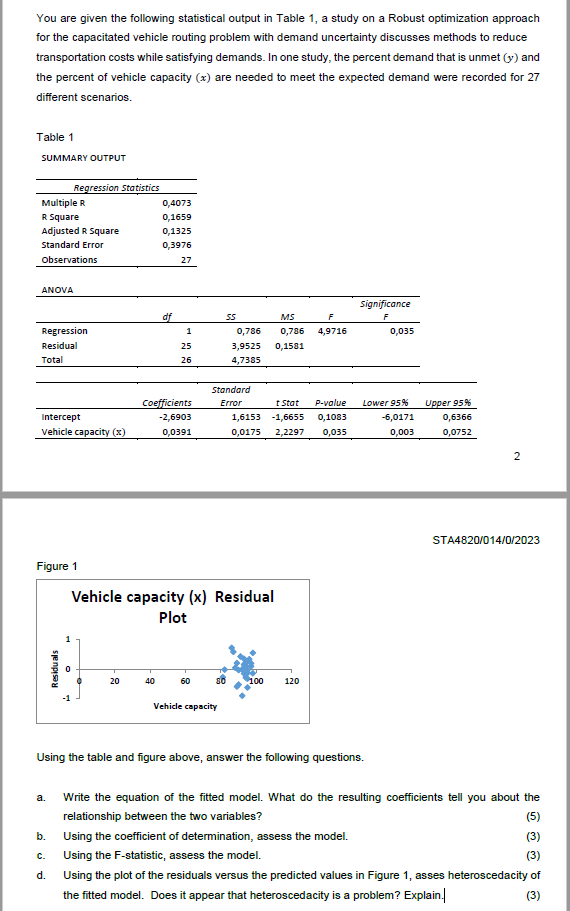
You are given the following statistical output in Table 1, a study on a Robust optimization approach for the capacitated vehicle routing problem with demand uncertainty discusses methods to reduce transportation costs while satisfying demands. In one study, the percent demand that is unmet (y) and the percent of vehicle capacity (x) are needed to meet the expected demand were recorded for 27 different scenarios. Table 1 SUMMARY OUTPUT ANOVA STA4820/014/0/2023 Figure 1 Using the table and figure above, answer the following questions. a. Write the equation of the fitted model. What do the resulting coefficients tell you about the relationship between the two variables? (5) b. Using the coefficient of determination, assess the model. (3) c. Using the F-statistic, assess the model. (3) d. Using the plot of the residuals versus the predicted values in Figure 1, asses heteroscedacity of the fitted model. Does it appear that heteroscedacity is a problem? Explain. (3)
Step by Step Solution
There are 3 Steps involved in it

Get step-by-step solutions from verified subject matter experts