

Question: You are given the sample mean and the population standard deviation. Use this information to construct the 90% and 95% confidence intervals for the population
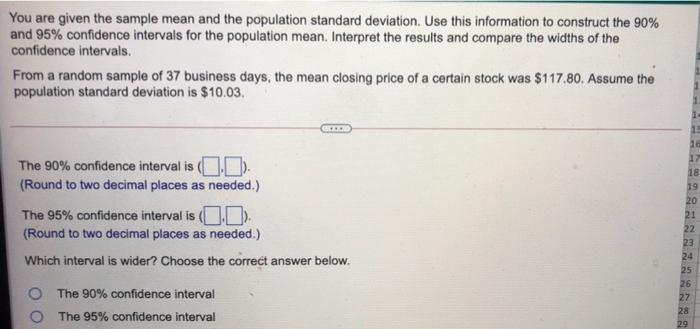
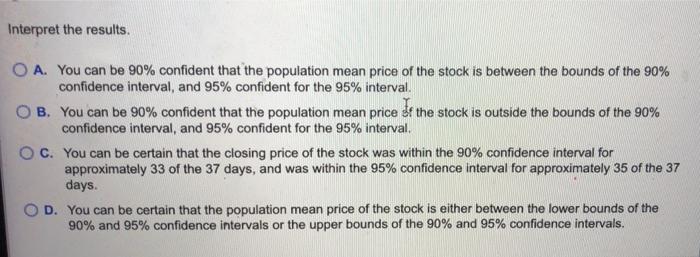
You are given the sample mean and the population standard deviation. Use this information to construct the 90% and 95% confidence intervals for the population mean. Interpret the results and compare the widths of the confidence intervals. From a random sample of 37 business days, the mean closing price of a certain stock was $117.80. Assume the population standard deviation is $10.03. 17 19 The 90% confidence interval is (CD). (Round to two decimal places as needed.) The 95% confidence interval is (1.0). (Round to two decimal places as needed.) Which interval is wider? Choose the correct answer below. 24 25 26 27 O The 90% confidence interval The 95% confidence interval 29 Interpret the results. O A. You can be 90% confident that the population mean price of the stock is between the bounds of the 90% confidence interval, and 95% confident for the 95% interval. OB. You can be 90% confident that the population mean price If the stock is outside the bounds of the 90% confidence interval, and 95% confident for the 95% interval O c. You can be certain that the closing price of the stock was within the 90% confidence interval for approximately 33 of the 37 days, and was within the 95% confidence interval for approximately 35 of the 37 days. OD. You can be certain that the population mean price of the stock is either between the lower bounds of the 90% and 95% confidence intervals or the upper bounds of the 90% and 95% confidence intervals
Step by Step Solution
There are 3 Steps involved in it

Get step-by-step solutions from verified subject matter experts