

Question: You are given the sample mean and the population standard deviation. Use this information to construct the 90% and 95% confidence intervals for the population
You are given the sample mean and the population standard deviation. Use this information to construct the 90% and 95% confidence intervals for the population mean.
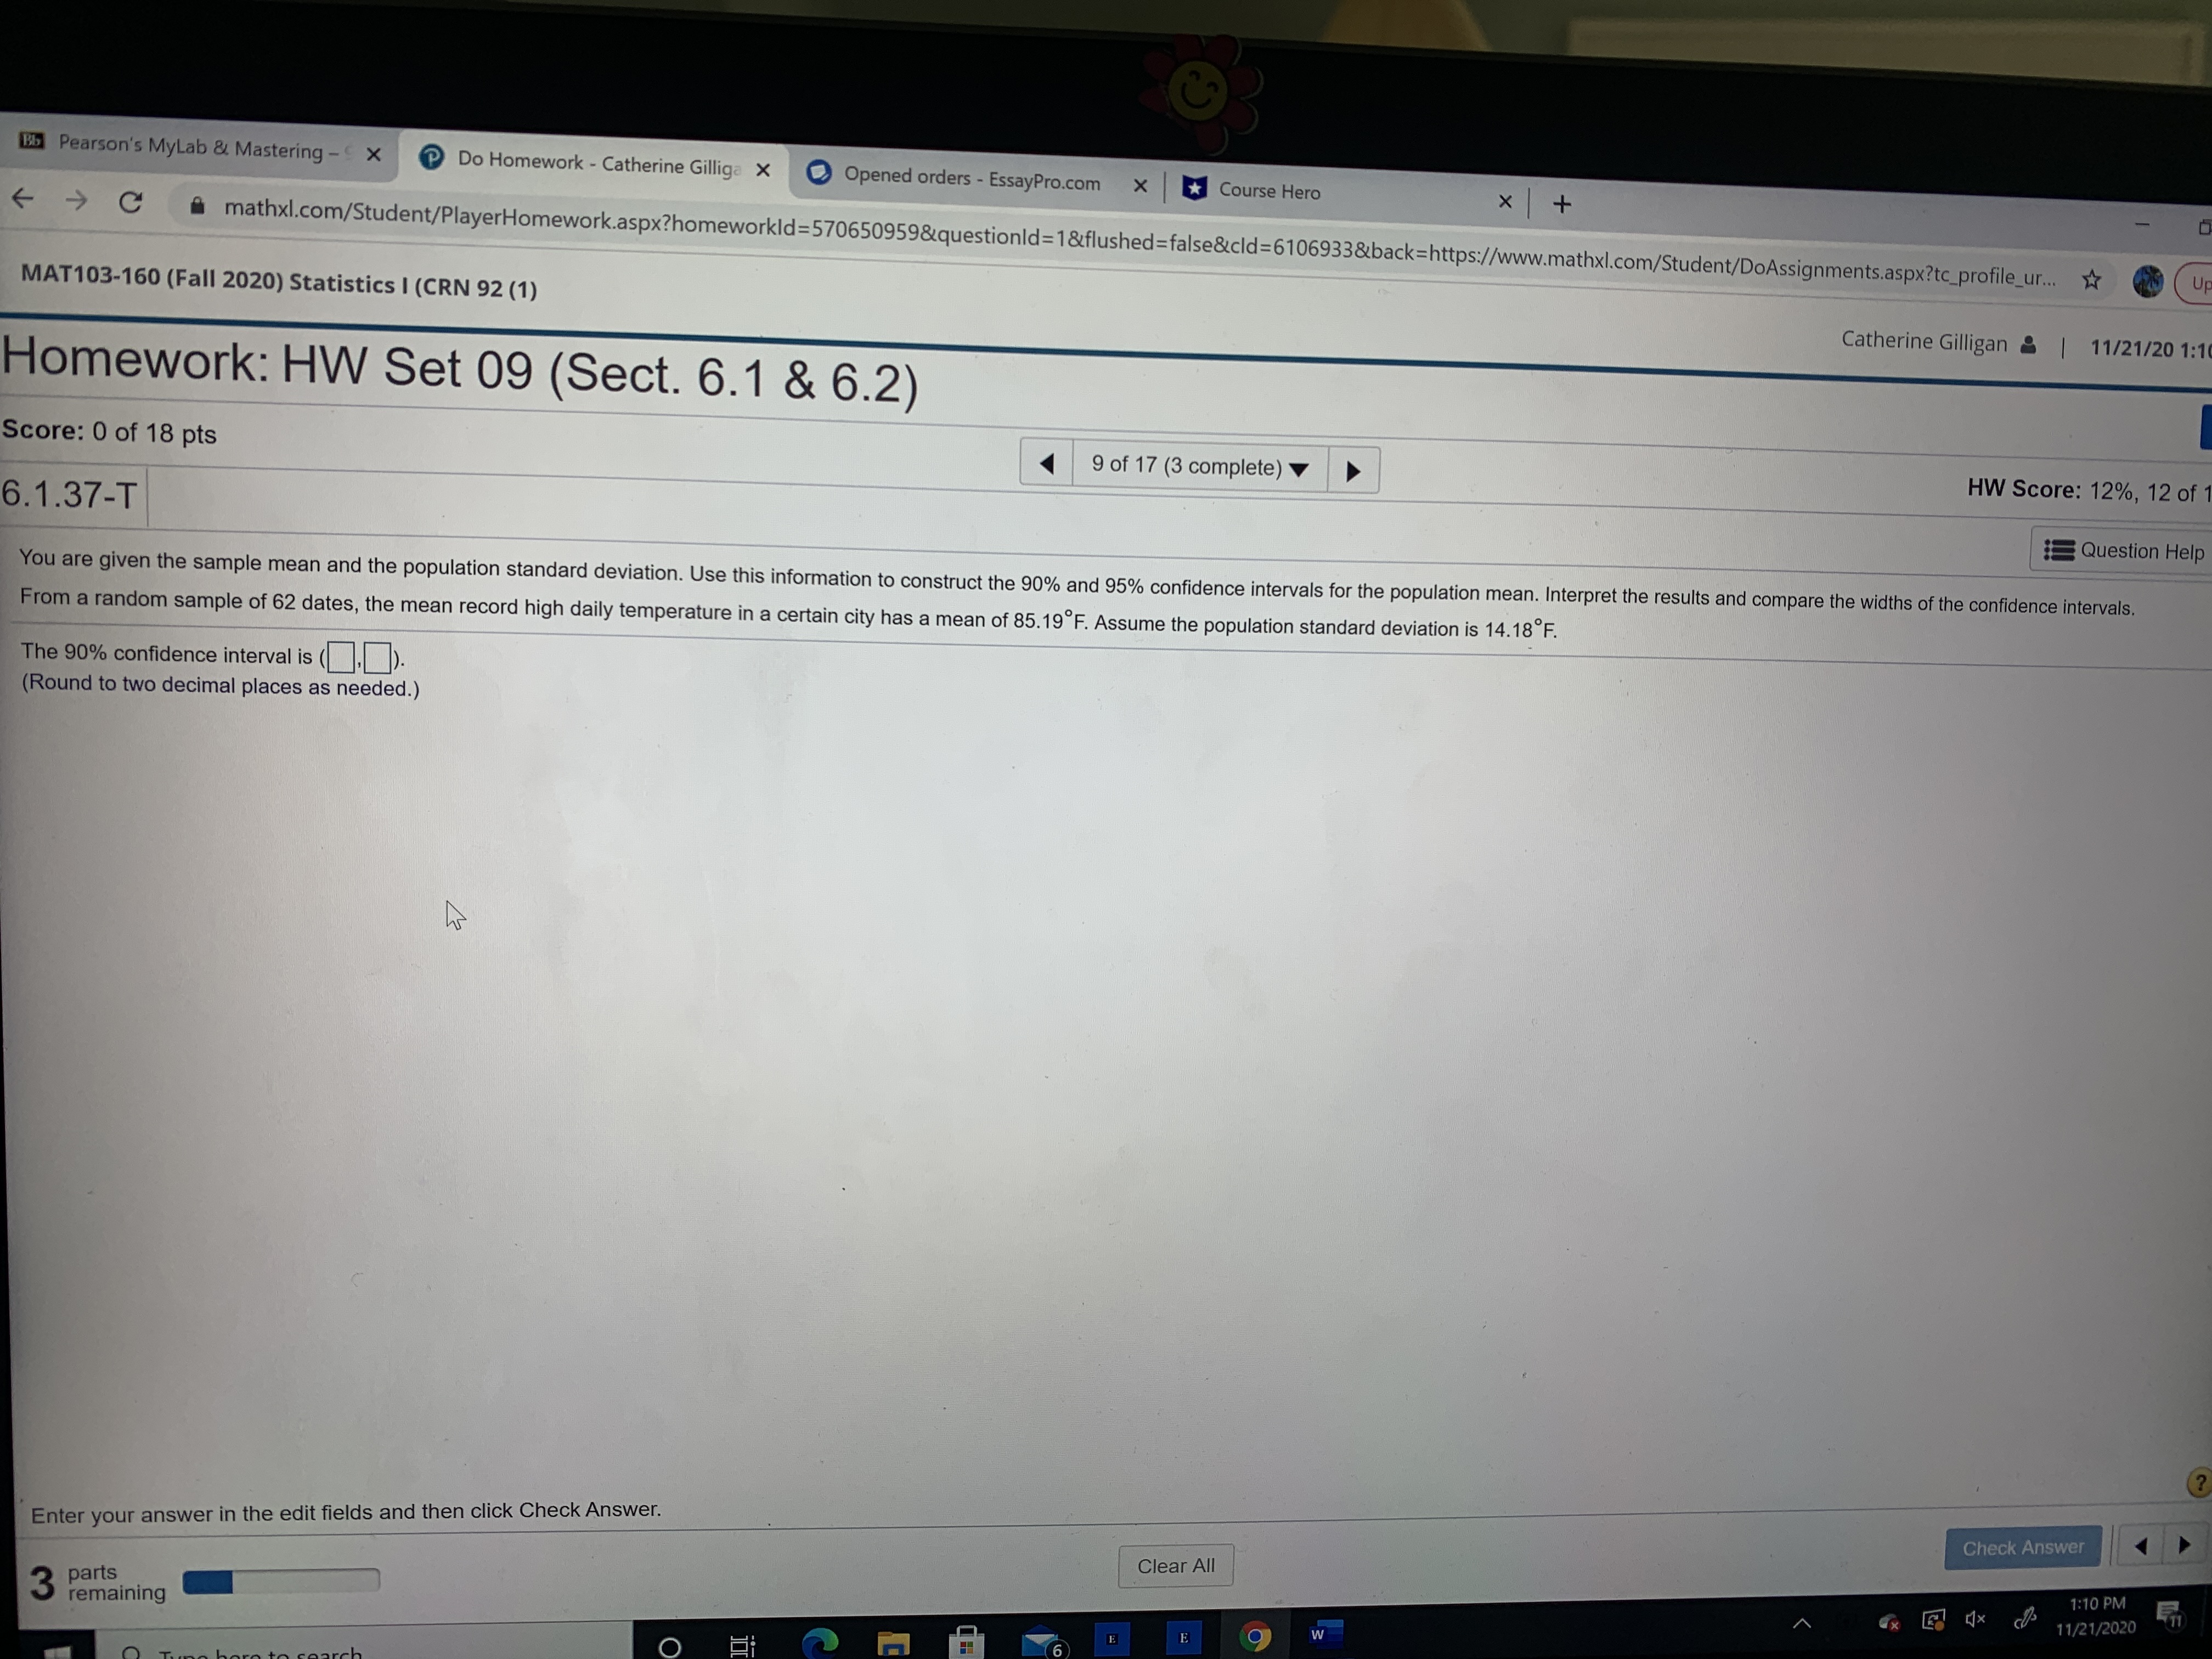
Bb Pearson's MyLab & Mastering - X Do Homework - Catherine Gilliga X Opened orders - EssayPro.com x Course Hero + mathxl.com/Student/PlayerHomework.aspx?homeworkld=570650959&questionld=1&flushed=false&cld=6106933&back=https://www.mathxl.com/Student/DoAssignments.aspx?tc_profile_ur... * MAT103-160 (Fall 2020) Statistics I (CRN 92 (1) Catherine Gilligan & | 11/21/20 1:1 Homework: HW Set 09 (Sect. 6.1 & 6.2) Score: 0 of 18 pts 1 9 of 17 (3 complete) HW Score: 12%, 12 of 6.1.37-T Question Help You are given the sample mean and the population standard deviation. Use this information to construct the 90% and 95% confidence intervals for the population mean. Interpret the results and compare the widths of the confidence intervals. From a random sample of 62 dates, the mean record high daily temperature in a certain city has a mean of 85.19 F. Assume the population standard deviation is 14.18 F. The 90% confidence interval is ( (Round to two decimal places as needed.) Enter your answer in the edit fields and then click Check Answer. Check Answer Clear All 3 parts 1:10 PM remaining x x cl/ 11/21/2020 E 9 w O M 6
Step by Step Solution
There are 3 Steps involved in it

Get step-by-step solutions from verified subject matter experts