

Question: You are looking at a dataset that contains the observations from an experiment comparing the growth of 30 plants, as measured by their dried weight.
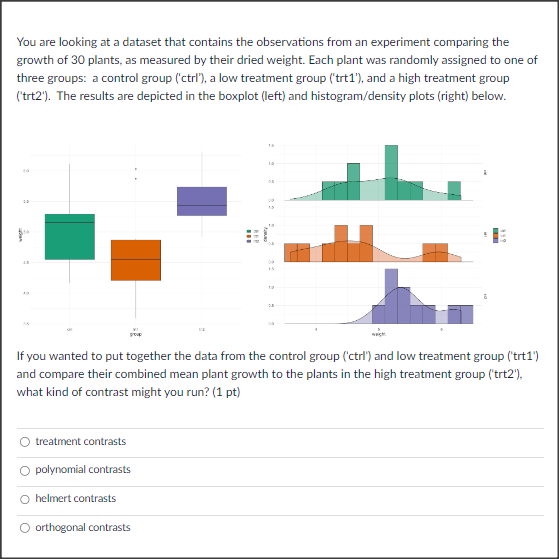

You are looking at a dataset that contains the observations from an experiment comparing the growth of 30 plants, as measured by their dried weight. Each plant was randomly assigned to one of three groups: a control group (ctrl'), a low treatment group (trt1'), and a high treatment group (trt2'). The results are depicted in the boxplot (left) and histogram/density plots (right) below. If you wanted to put together the data from the control group ('ctrl') and low treatment group ('trt1") and compare their combined mean plant growth to the plants in the high treatment group ('trt2"), what kind of contrast might you run? (1 pt) O treatment contrasts O polynomial contrasts O helmert contrasts O orthogonal contrasts
Step by Step Solution
There are 3 Steps involved in it

Get step-by-step solutions from verified subject matter experts