

Question: Module 74 Featured Worksheet 1 Externalities 1. Label the equilibrium price and quantity as P1 and Q1 on the graphs below. 2. What situation is

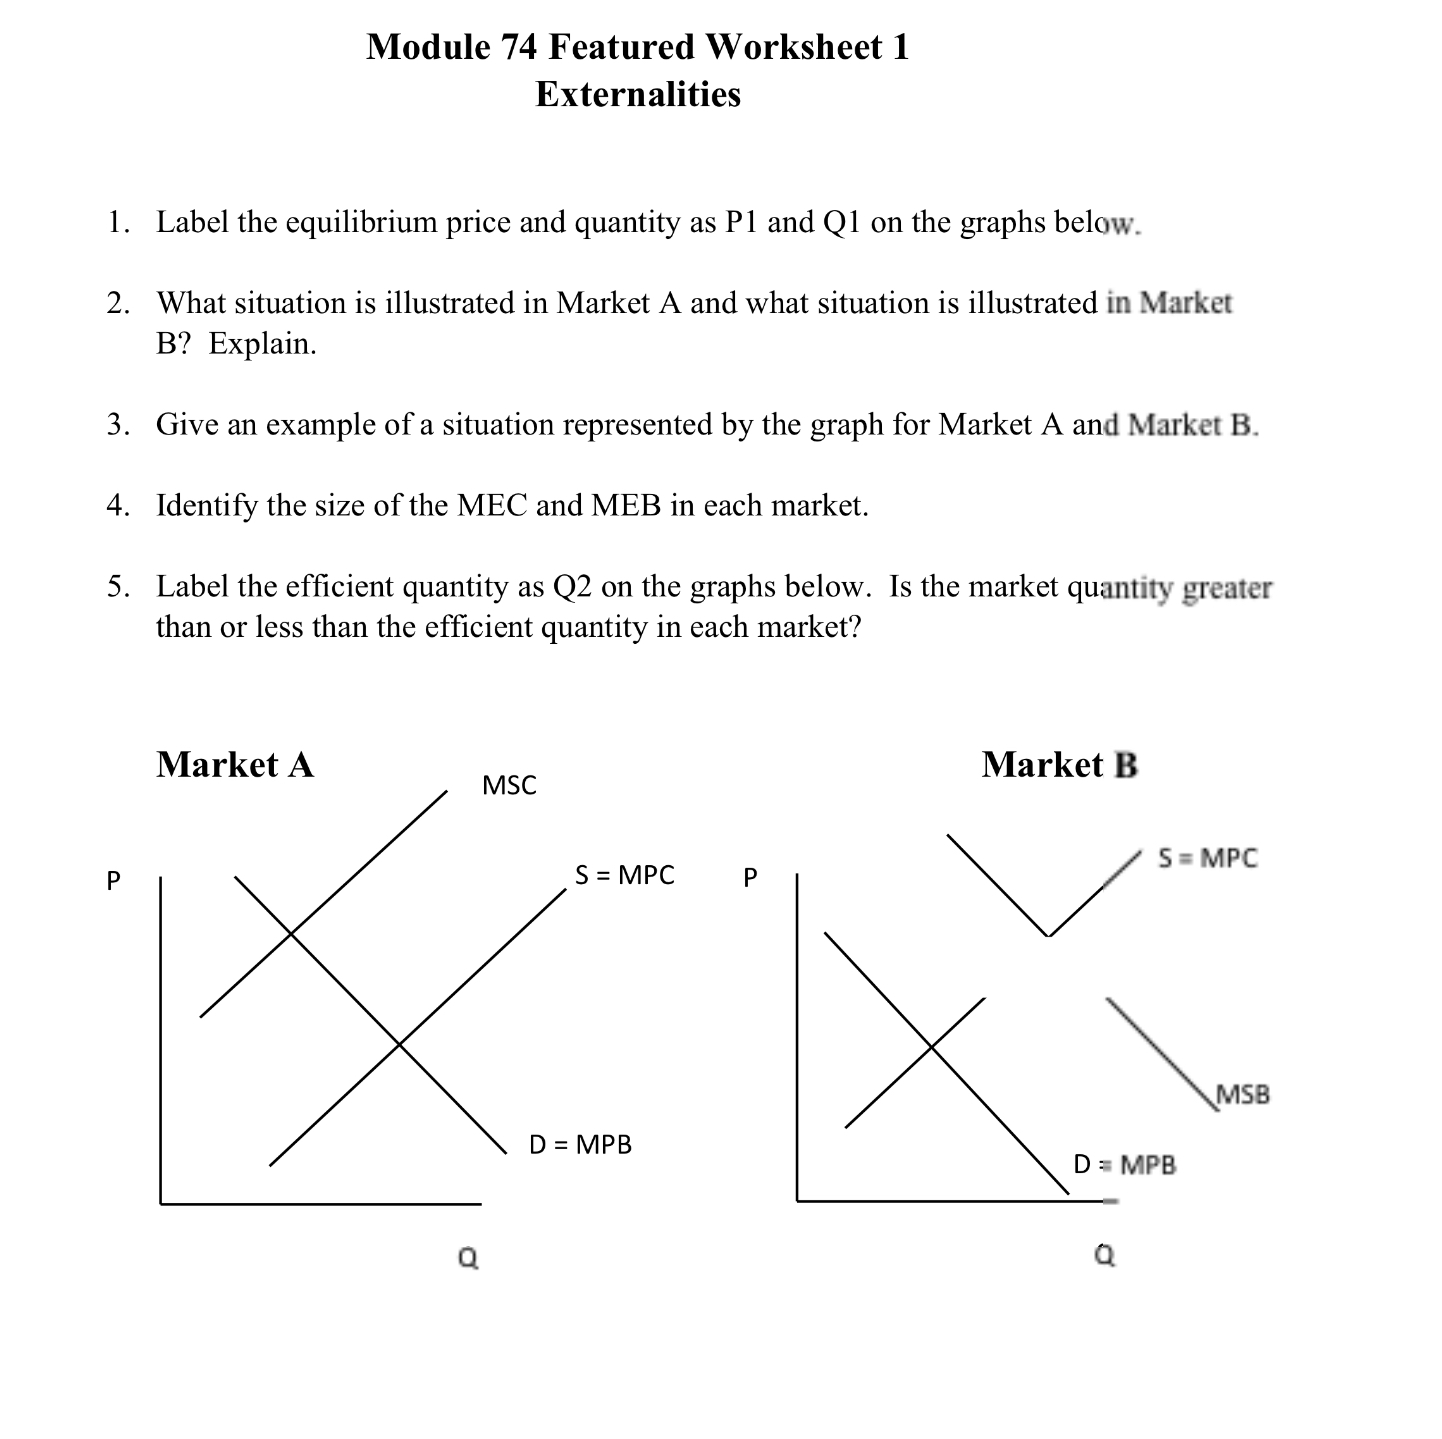
Module 74 Featured Worksheet 1 Externalities 1. Label the equilibrium price and quantity as P1 and Q1 on the graphs below. 2. What situation is illustrated in Market A and what situation is illustrated in Market B? Explain. 3. Give an example of a situation represented by the graph for Market A and Market B. 4. Identify the size of the MEC and MEB in each market. 5. Label the efficient quantity as Q2 on the graphs below. Is the market quantity greater than or less than the efficient quantity in each market? Market A Market B MSC S = MPC P P MSB D = MPB
Step by Step Solution
There are 3 Steps involved in it
1 Expert Approved Answer
Step: 1 Unlock

Question Has Been Solved by an Expert!
Get step-by-step solutions from verified subject matter experts
Step: 2 Unlock
Step: 3 Unlock