

Question: . You are looking at a population and are interested in the proportion p that has a certain characteristic. Unknown to you, this population proportion
.
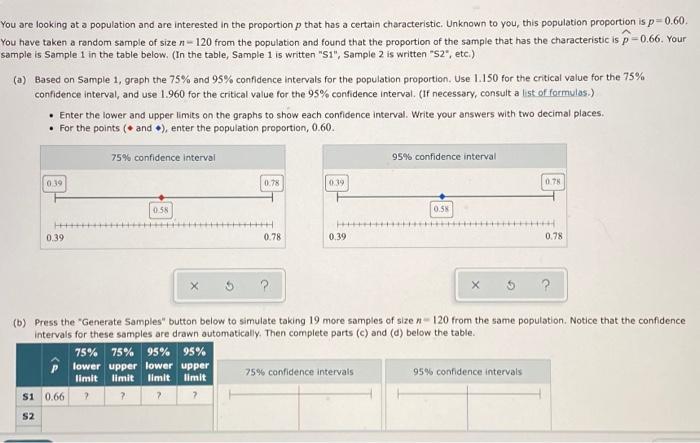
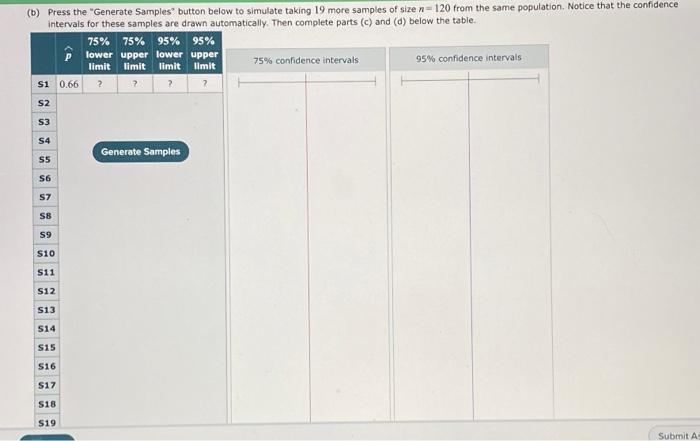
You are looking at a population and are interested in the proportion p that has a certain characteristic. Unknown to you, this population proportion is p=0.60. You have taken a random sample of size - 120 from the population and found that the proportion of the sample that has the characteristic is p=0.66. Your sample is Sample 1 in the table below. (In the table, Sample 1 is written "S1", Sample 2 is written "S2", etc.) (a) Based on Sample 1, graph the 75% and 95% confidence intervals for the population proportion. Use 1.150 for the critical value for the 75% confidence interval, and use 1.960 for the critical value for the 95% confidence interval. (If necessary, consult a list of formulas.) Enter the lower and upper limits on the graphs to show each confidence interval. Write your answers with two decimal places. For the points (and), enter the population proportion, 0.60. 0.39 0.39 75% confidence interval $1 0.66 S2 0.58 0.78 75% 75% 95% 95% lower upper lower upper limit limit limit limit ? ? ? ? HH 0.78 0.39 +++ 0.39 95% confidence interval 75% confidence intervals 0.58 (b) Press the "Generate Samples" button below to simulate taking 19 more samples of size - 120 from the same population. Notice that the confidence intervals for these samples are drawn automatically. Then complete parts (c) and (d) below the table. 0.78 95% confidence intervals 0.78 ?
Step by Step Solution
3.53 Rating (156 Votes )
There are 3 Steps involved in it
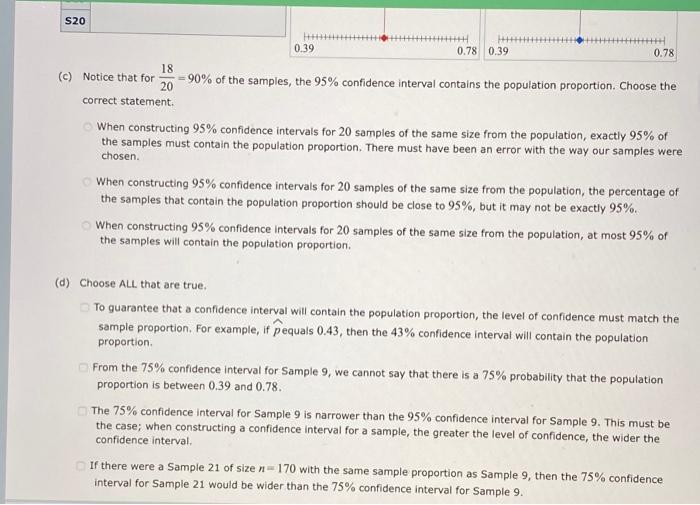
Question c The proportion of the samples that include the population proportion should be near to 95 ... View full answer

Get step-by-step solutions from verified subject matter experts