

Question: You are performing a study about weekly per capita milk consumption. A previous study found weekly per capita milk consumption to be normally distributed, with

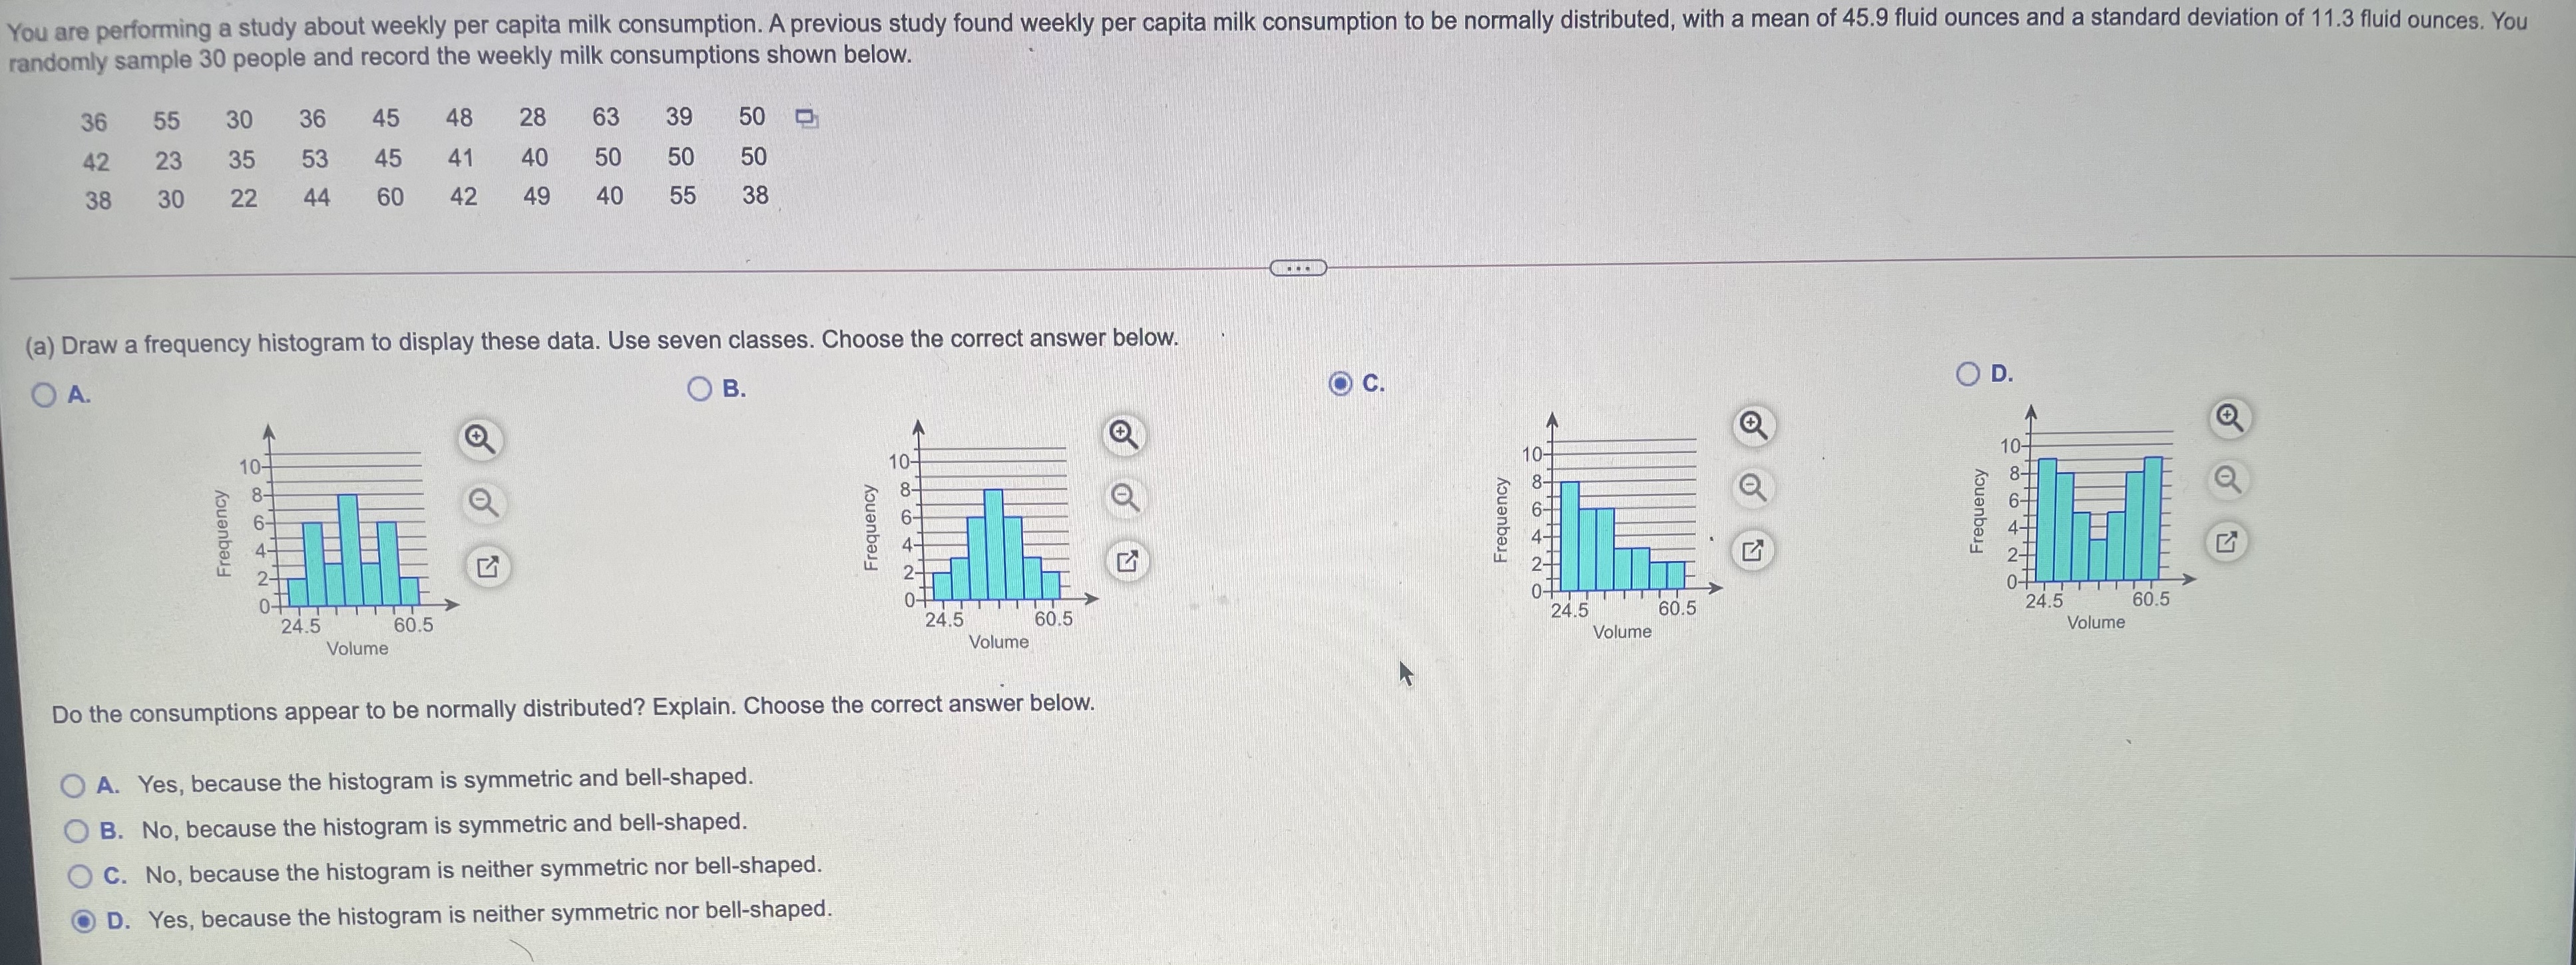
You are performing a study about weekly per capita milk consumption. A previous study found weekly per capita milk consumption to be normally distributed, with a mean of 45.9 fluid ounces and a standard deviation of 11.3 fluid ounces. You randomly sample 30 people and record the weekly milk consumptions shown below. 36 55 30 36 45 48 28 63 39 50 42 23 35 53 45 41 40 50 50 50 38 30 22 44 60 42 49 40 55 38 (a) Draw a frequency histogram to display these data. Use seven classes. Choose the correct answer below. O A. O B. O C. OD. Frequency Frequency Frequency Frequency 24.5 60.5 24.5 60.5 24.5 60.5 24.5 60.5 Volume Volume Volume Volume Do the consumptions appear to be normally distributed? Explain. Choose the correct answer below. O A. Yes, because the histogram is symmetric and bell-shaped. O B. No, because the histogram is symmetric and bell-shaped. O C. No, because the histogram is neither symmetric nor bell-shaped. O D. Yes, because the histogram is neither symmetric nor bell-shaped
Step by Step Solution
There are 3 Steps involved in it

Get step-by-step solutions from verified subject matter experts