

Question: You are provided with the following summary tables from a local survey. The households are grouped by income level and household size. Table 8-1:
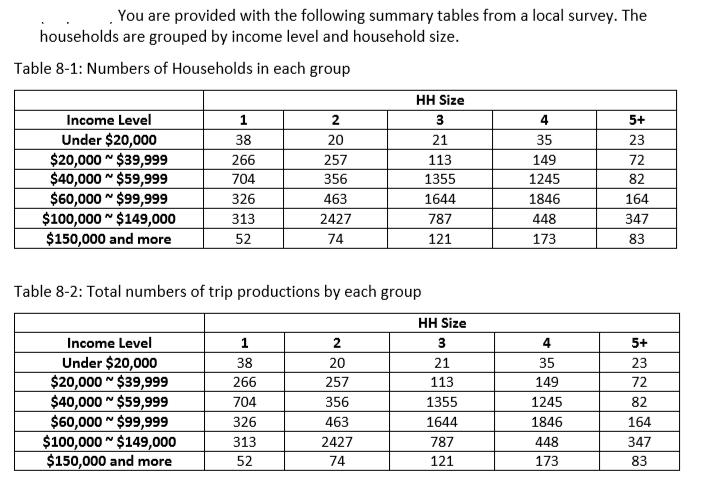
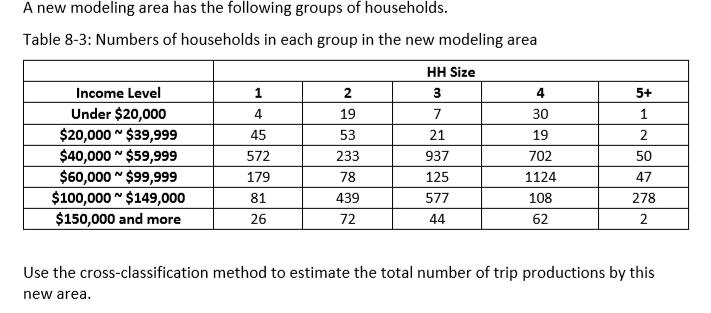
You are provided with the following summary tables from a local survey. The households are grouped by income level and household size. Table 8-1: Numbers of Households in each group Income Level Under $20,000 $20,000 $39,999 $40,000 $59,999 $60,000 $99,999 $100,000 $149,000 $150,000 and more N N N Income Level Under $20,000 $20,000 $39,999 $40,000 $59,999 $60,000 $99,999 $100,000 $149,000 $150,000 and more M N N 1 38 Table 8-2: Total numbers of trip productions by each group N 266 704 326 313 52 2 20 257 356 463 1 38 266 704 326 313 52 2427 74 HH Size 3 21 113 1355 1644 787 121 2 20 257 356 463 2427 74 HH Size 3 21 113 1355 1644 787 121 4 35 149 1245 1846 448 173 4 35 149 1245 1846 448 173 5+ 23 72 82 164 347 83 5+ 23 72 82 164 347 83 A new modeling area has the following groups of households. Table 8-3: Numbers of households in each group in the new modeling area Income Level Under $20,000 $20,000~ $39,999 $40,000~ $59,999 $60,000 $99,999 $100,000 $149,000 $150,000 and more N 1 4 45 572 179 81 26 2 19 53 233 78 439 72 HH Size 3 7 21 937 125 577 44 4 30 19 702 1124 108 62 5+ 1 2 50 47 278 2 Use the cross-classification method to estimate the total number of trip productions by this new area.
Step by Step Solution
3.41 Rating (160 Votes )
There are 3 Steps involved in it
Answer Numbers of Households in each grouptable 81 and Total ... View full answer

Get step-by-step solutions from verified subject matter experts