

Question: You are required to predict the future economic state based on each of the yield curves shown in the figure 1. Please note that I
- You are required to predict the future economic state based on each of the yield curves shown in the figure 1.
Please note that I will NOT accept bullet points only; some explanations should accompany each answer.
(2) What should have been the future direction of US interest rates (retrospectively) given the shape of each yield curve in Figure 1?
(3) Now look at the US real interest rates over time in Figure 2 and analyse whether the real interest rate changes were in accordance with the interest rate YOU forecasted in (2) based on the shape of each yield curve in Figure 1.
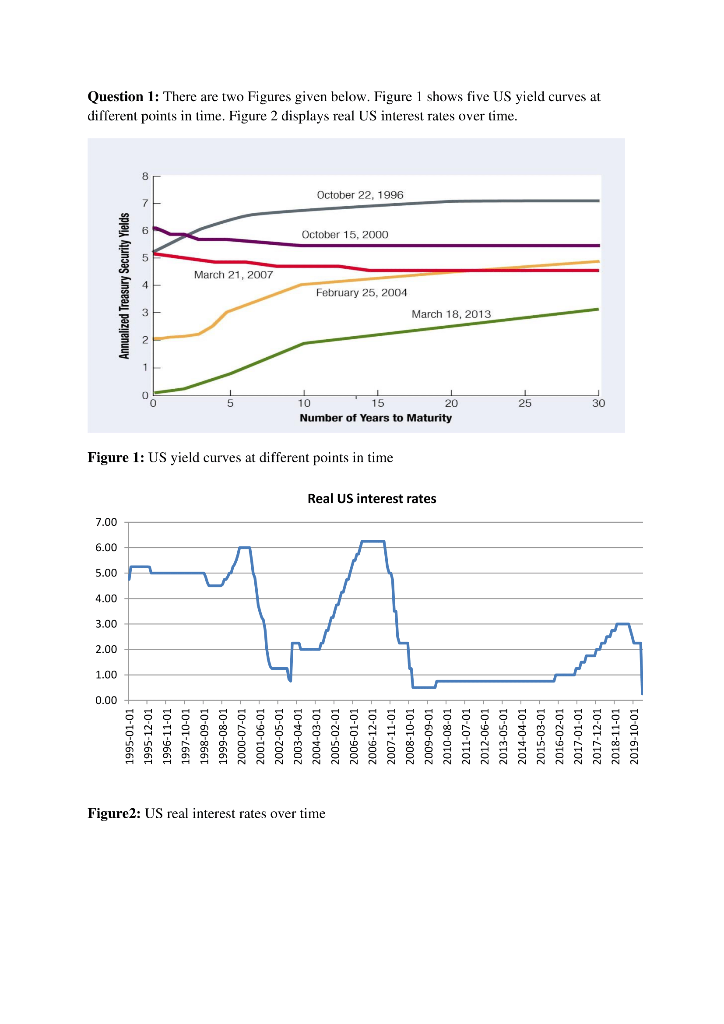
0.00 1.00 Annualized Treasury Security Yields Figure2: US real interest rates over time Figure 1: US yield curves at different points in time March 21, 2007 1995-01-01 1995-12-01 1996-11-01 1997-10-01 1998-09-01 1999-08-01 2000-07-01 2001-06-01 2002-05-01 2003-04-01 2004-03-01 2005-02-01 2006-01-01 2006-12-01 2007-11-01 2008-10-01 2009-09-01 2010-08-01 2011-07-01 2012-06-01 2013-05-01 2014-04-01 2015-03-01 2016-02-01 2017-01-01 2017-12-01 2018-11-01 2019-10-01 10 Real US interest rates Number of Years to Maturity October 15, 2000 October 22, 1996 different points in time, Figure 2 displays real US interest rates over time. Question 1: There are two Figures given below. Figure 1 shows five US yield curves at February 25, 2004 March 18, 2013 15 20 25 30 0.00 1.00 Annualized Treasury Security Yields Figure2: US real interest rates over time Figure 1: US yield curves at different points in time March 21, 2007 1995-01-01 1995-12-01 1996-11-01 1997-10-01 1998-09-01 1999-08-01 2000-07-01 2001-06-01 2002-05-01 2003-04-01 2004-03-01 2005-02-01 2006-01-01 2006-12-01 2007-11-01 2008-10-01 2009-09-01 2010-08-01 2011-07-01 2012-06-01 2013-05-01 2014-04-01 2015-03-01 2016-02-01 2017-01-01 2017-12-01 2018-11-01 2019-10-01 10 Real US interest rates Number of Years to Maturity October 15, 2000 October 22, 1996 different points in time, Figure 2 displays real US interest rates over time. Question 1: There are two Figures given below. Figure 1 shows five US yield curves at February 25, 2004 March 18, 2013 15 20 25 30
Step by Step Solution
There are 3 Steps involved in it

Get step-by-step solutions from verified subject matter experts