

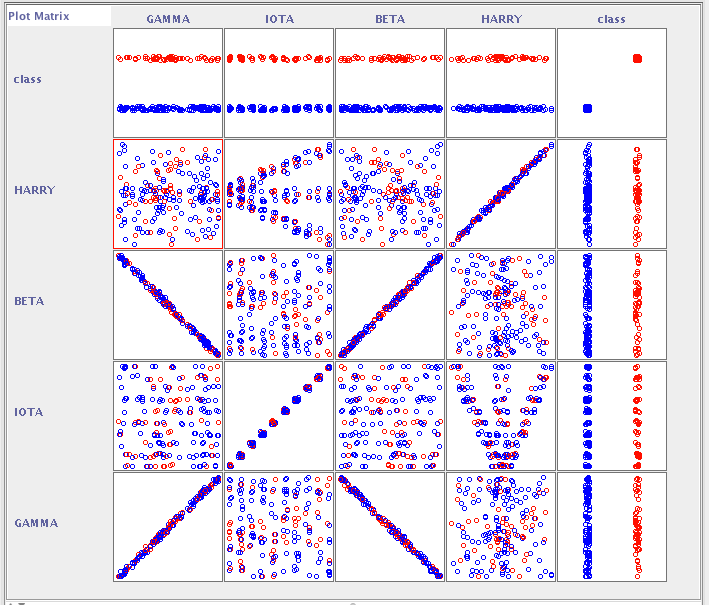
Question: You are working on a data-mining project in a domain you know well. You visualize a subset of the attributes (see below) as scatter plots.
You are working on a data-mining project in a domain you know well. You visualize a subset of the attributes (see below) as scatter plots. (Note that the names of the attributes: Gamma, Iota, Beta, and Harry are completely meaningless, and are intended to be ambiguous as to not pre-dispose you to a particular answer.) 2.a.) What do you conclude from the scatter plots? 2.b.) If you cant conclude anything from the plot, what is your next step? 2.c.) What, if anything, would to do (or, at least, attempt to do) with this data based on the scatter plots alone?
GAMMA IOTA BETA HARRY class Plot Matrix . 000 0000 . 000 0000 GAMMA gu 0000 ool 10. 000000 10000 | 20000 0000 Tv . 0008 2008 18 000 2000 . 000000 . 00000 || 28 .. ago 80 00008 oto 88 od Co 208 0086 .. IOTA 100000000000 000 lo 8 S . 0060 08.00 oooo .... 0000 e 08 00000 &n poco o BETA 0.00 SO 08 Com 80 D o .00 HARRY po Conna . class GAMMA IOTA BETA HARRY class Plot Matrix . 000 0000 . 000 0000 GAMMA gu 0000 ool 10. 000000 10000 | 20000 0000 Tv . 0008 2008 18 000 2000 . 000000 . 00000 || 28 .. ago 80 00008 oto 88 od Co 208 0086 .. IOTA 100000000000 000 lo 8 S . 0060 08.00 oooo .... 0000 e 08 00000 &n poco o BETA 0.00 SO 08 Com 80 D o .00 HARRY po Conna . class
Step by Step Solution
There are 3 Steps involved in it

Get step-by-step solutions from verified subject matter experts