

Question: *YOU CAN USE ANY PROGRAMMING LANGUAGE* Question 6 (Heatmap) Heat map is a graphical representation of data where the individual values contained in a matrix
*YOU CAN USE ANY PROGRAMMING LANGUAGE*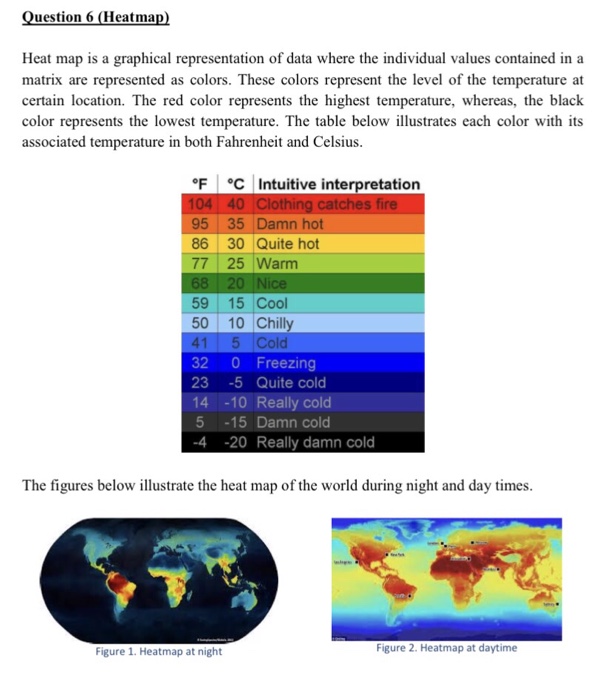
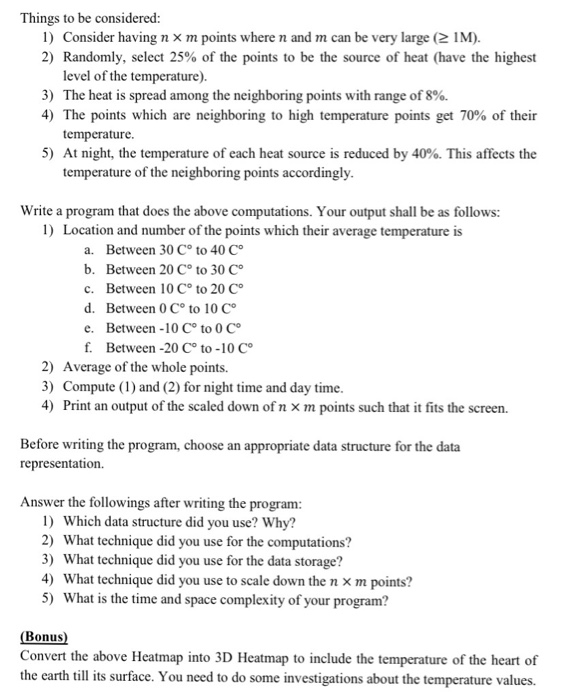
Question 6 (Heatmap) Heat map is a graphical representation of data where the individual values contained in a matrix are represented as colors. These colors represent the level of the temperature at certain location. The red color represents the highest temperature, whereas, the black color represents the lowest temperature. The table below illustrates each color with its associated temperature in both Fahrenheit and Celsius F CIntuitive interpretation 04 40 Clothing catches fire 95 35 Damn hot 86 30 Quite hot 77 25 Warm 59 15 Coo 50 | 10 Chil 41 5 Cold 32 0 Freezing 23 -5 Quite cold 14 -10 Really cold 5 -15 Damn cold 4 -20 Really damn cold The figures below illustrate the heat map of the world during night and day times. Figure 1. Heatmap at night Figure 2. Heatmap at daytime
Step by Step Solution
There are 3 Steps involved in it

Get step-by-step solutions from verified subject matter experts