

Question: You can use Matlab for generating the Bode and Nyquist plot for this homework. ( 1 ) Consider the buck converter circuit below. . The
You can use Matlab for generating the Bode and Nyquist plot for this homework.
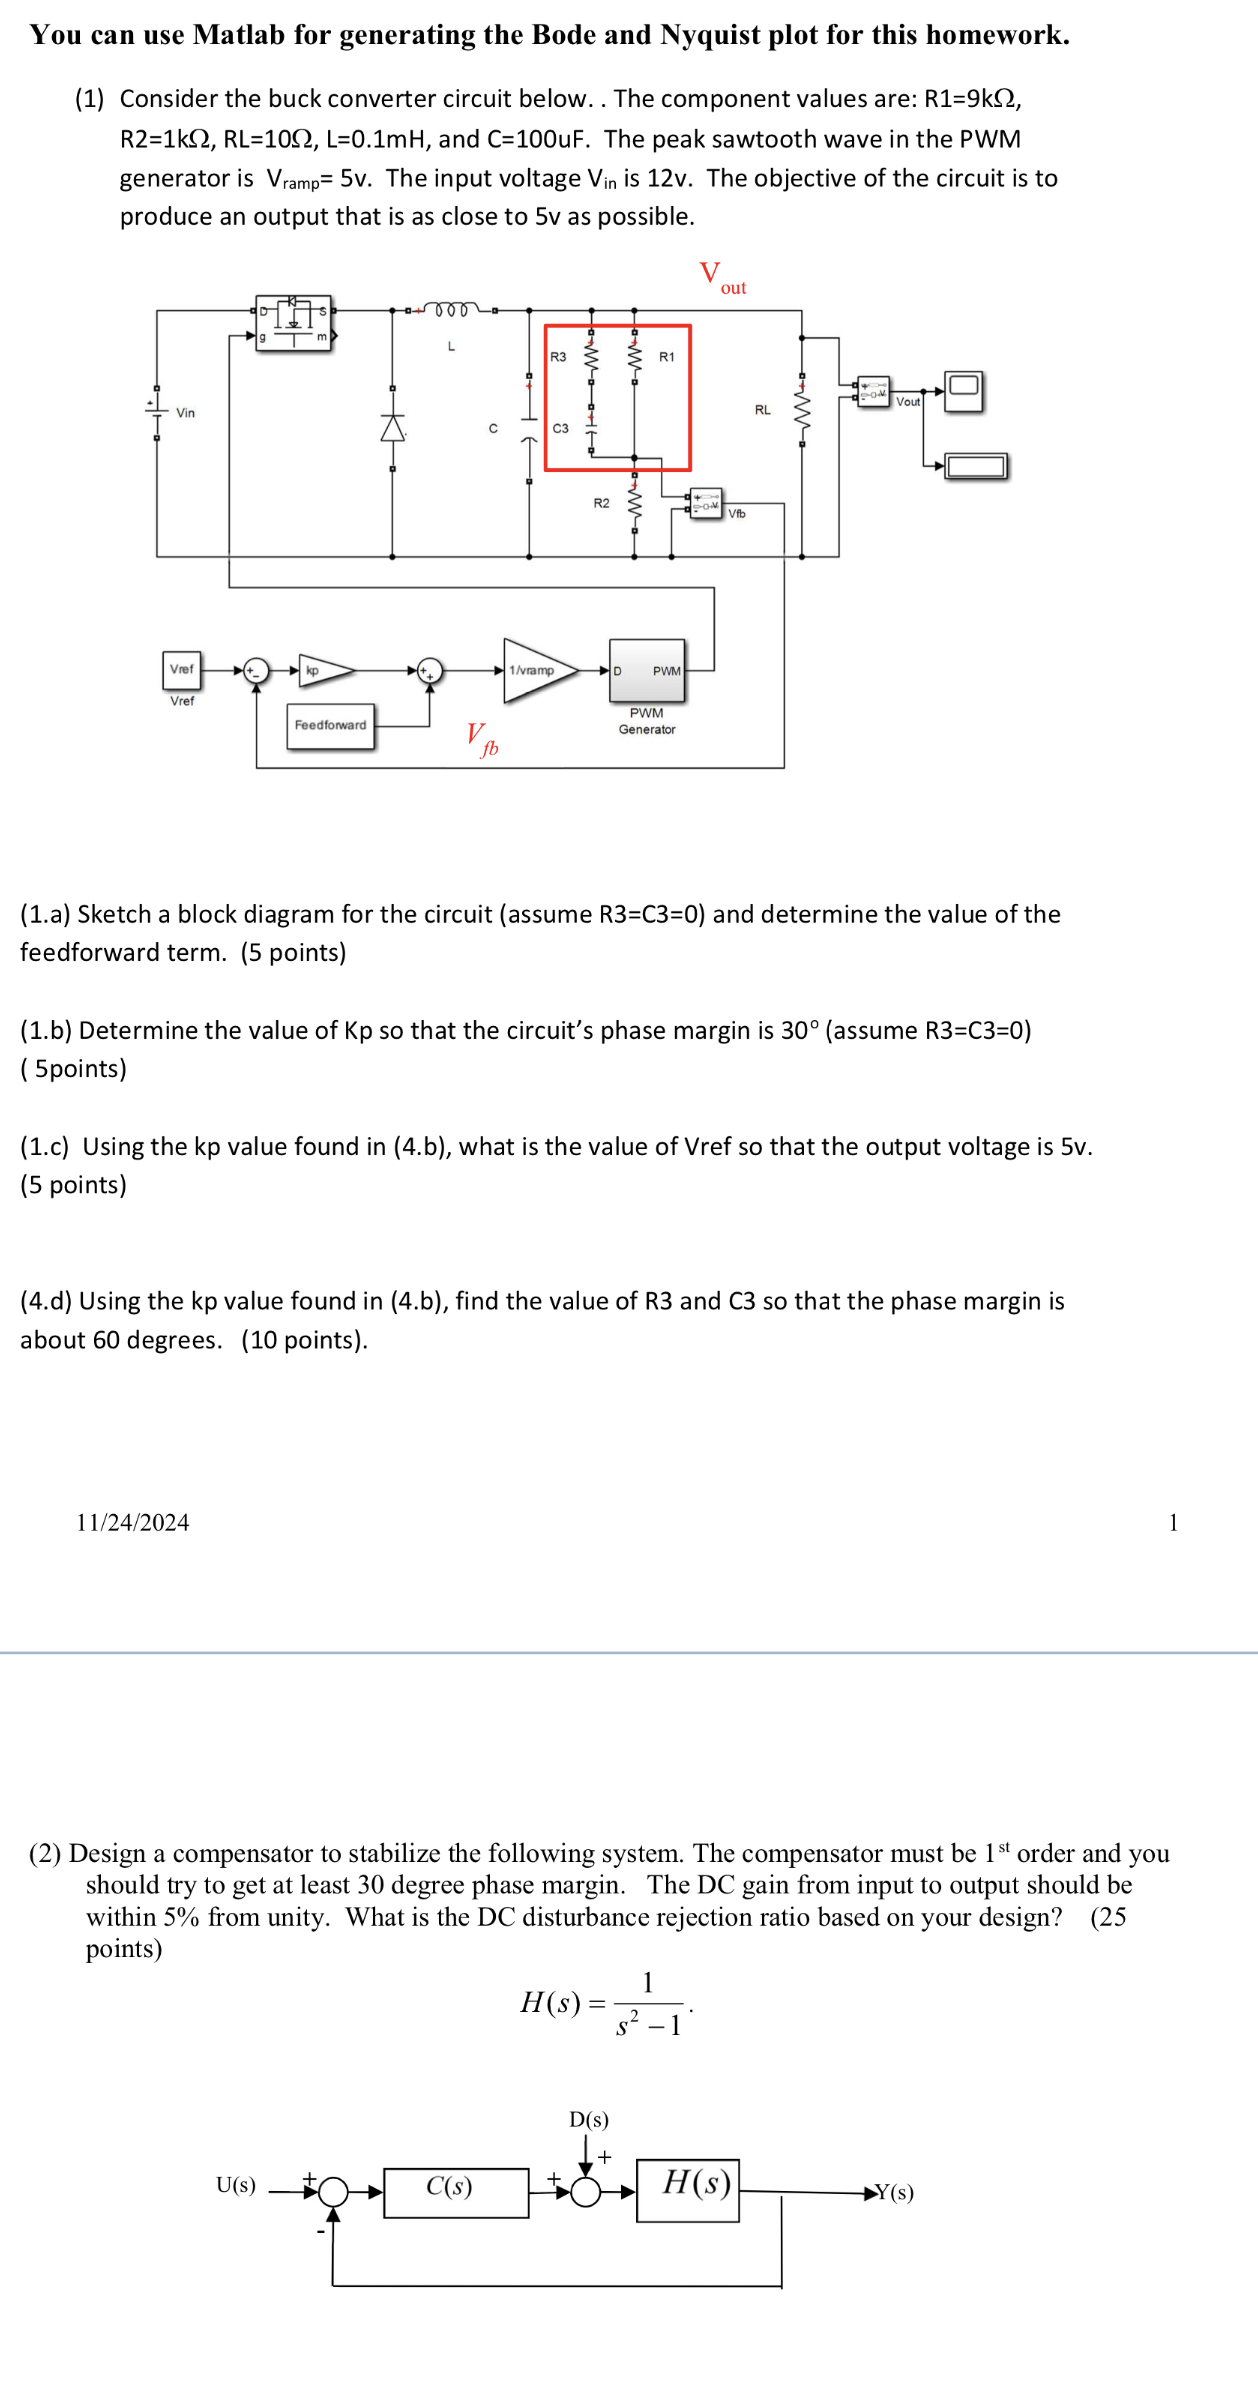
Consider the buck converter circuit below. The component values are: and The peak sawtooth wave in the PWM generator is The input voltage is v The objective of the circuit is to produce an output that is as close to v as possible.
a Sketch a block diagram for the circuit assume and determine the value of the feedforward term. points
b Determine the value of Kp so that the circuit's phase margin is assume points
c Using the kp value found in b what is the value of Vref so that the output voltage is v points
d Using the kp value found in b find the value of R and C so that the phase margin is about degrees. points
Design a compensator to stabilize the following system. The compensator must be order and you should try to get at least degree phase margin. The DC gain from input to output should be within from unity. What is the DC disturbance rejection ratio based on your design? points
Step by Step Solution
There are 3 Steps involved in it
1 Expert Approved Answer
Step: 1 Unlock

Question Has Been Solved by an Expert!
Get step-by-step solutions from verified subject matter experts
Step: 2 Unlock
Step: 3 Unlock