

Question: You can use Matlab or R program. (1) Download the data of Marathon.csv from Blackboard. (2) Plot the histogram and plot the boxplots show the
You can use Matlab or R program.
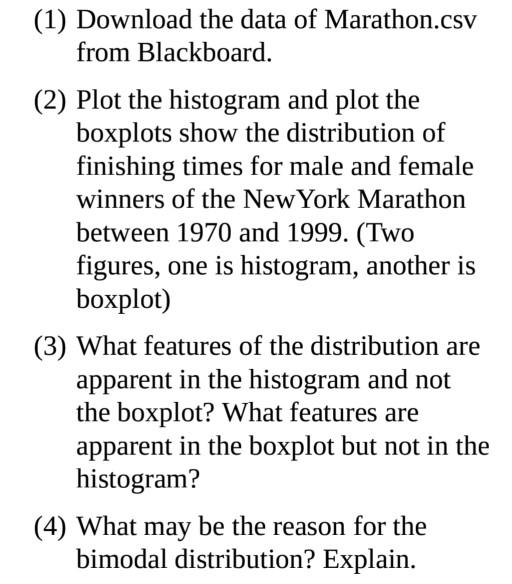
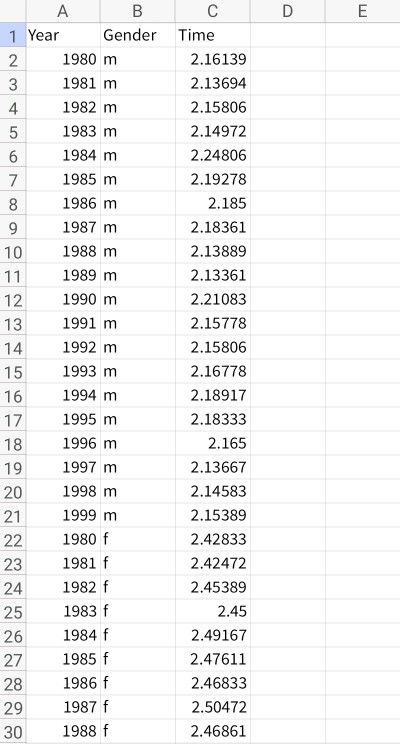
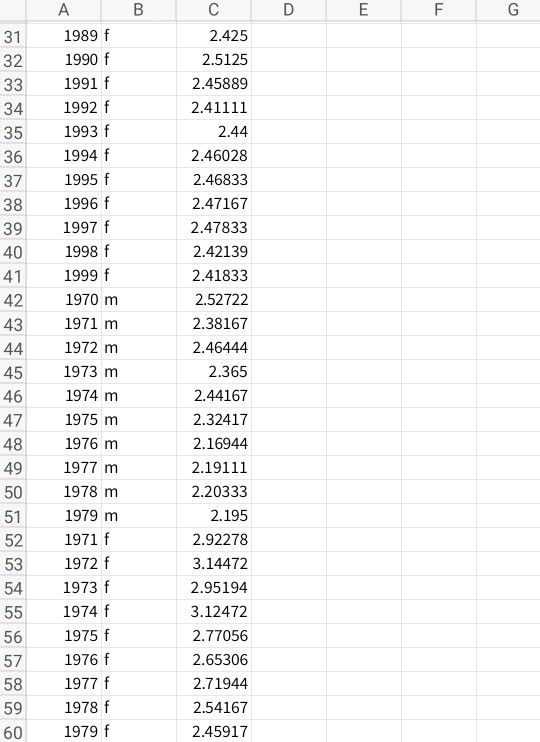
(1) Download the data of Marathon.csv from Blackboard. (2) Plot the histogram and plot the boxplots show the distribution of finishing times for male and female winners of the NewYork Marathon between 1970 and 1999. (Two figures, one is histogram, another is boxplot) (3) What features of the distribution are apparent in the histogram and not the boxplot? What features are apparent in the boxplot but not in the histogram? (4) What may be the reason for the bimodal distribution? Explain
Step by Step Solution
There are 3 Steps involved in it
1 Expert Approved Answer
Step: 1 Unlock

Question Has Been Solved by an Expert!
Get step-by-step solutions from verified subject matter experts
Step: 2 Unlock
Step: 3 Unlock