

Question: You can use Matlab or R program. 1. Marathon Winners (1) Download the data of Marathon.csv from Blackboard (2) Plot the histogram and plot the
You can use Matlab or R program.
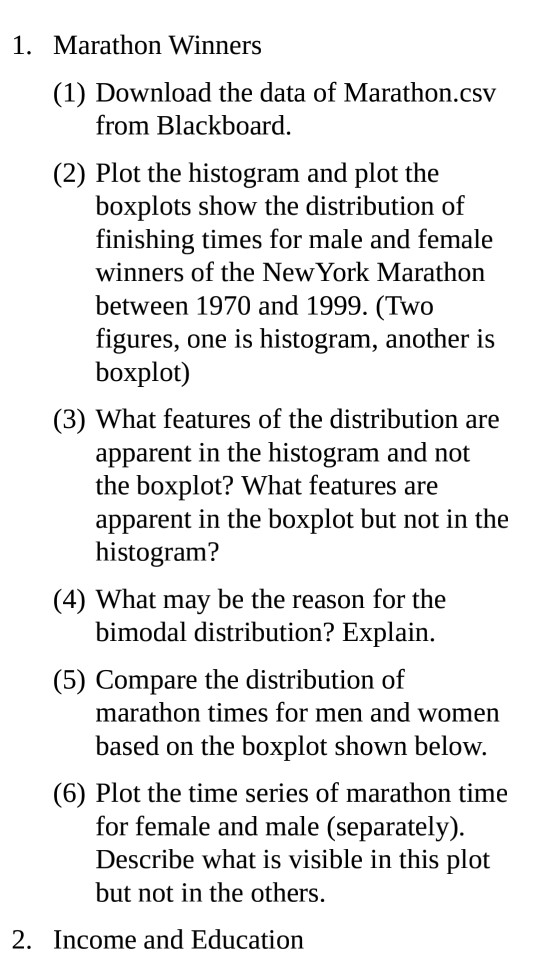
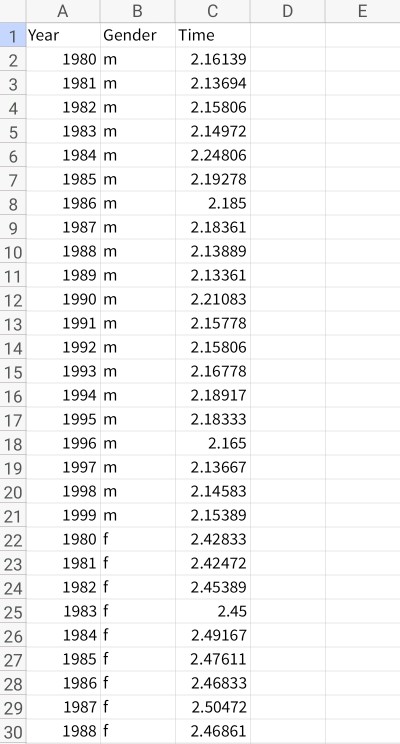
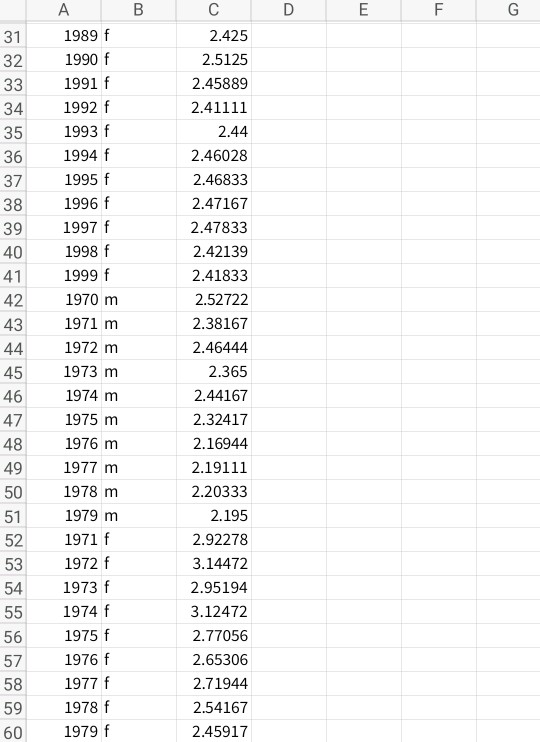
1. Marathon Winners (1) Download the data of Marathon.csv from Blackboard (2) Plot the histogram and plot the boxplots show the distribution of finishing times for male and female winners of the New York Marathon between 1970 and 1999. (Two figures, one is histogram, another is boxplot) (3) What features of the distribution are apparent in the histogram and not the boxplot? What features are apparent in the boxplot but not in the histogram? (4) What may be the reason for the bimodal distribution? Explain. (5) Compare the distribution of marathon times for men and women based on the boxplot shown below. (6) Plot the time series of marathon time for female and male (separately) Describe what is visible in this plot but not in the others. 2. Income and Educatioin
Step by Step Solution
There are 3 Steps involved in it

Get step-by-step solutions from verified subject matter experts