

Question: * you do not need to make charts. you only determine upper control limit and lower control limit and central line for each chart. (for
* you do not need to make charts. you only determine upper control limit and lower control limit and central line for each chart. (for part a)
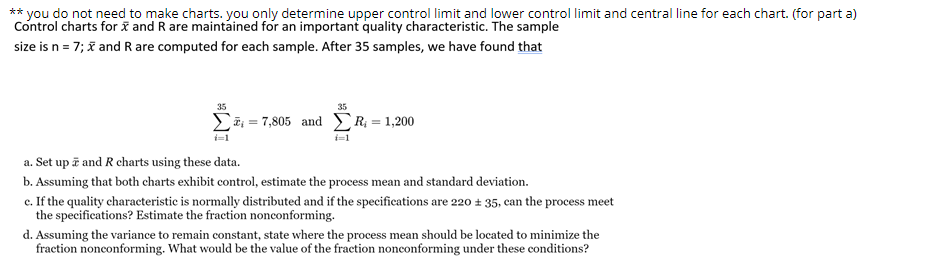
** you do not need to make charts. you only determine upper control limit and lower control limit and central line for each chart. (for part a] Control charts for f and R are maintained for an important quality characteristic. The sample size is n I i": f and R are oomputed for each sample. After 35 samples, we have found M IL Set up i and R charts using these data. b Assuming that both charts exhibit control. estimate the process mean and standard deviation. c: If the quality characteristic is norn'lail}r distributed and if the specications are 220 s 35. can the process meet the specications? Estimate the fraction nonconforming, d. Assuming the variance to remain constantr state where the process mean should he located to minimise the fraction nonconforming. What would. be the value ofthe fraction nonconforming under theoe conditions
Step by Step Solution
There are 3 Steps involved in it

Get step-by-step solutions from verified subject matter experts