

Question: You do not need to program anything, only to make a graph and plot the points. This is a civil engineering question not conputer science.
You do not need to program anything, only to make a graph and plot the points. This is a civil engineering question not conputer science. thanks!
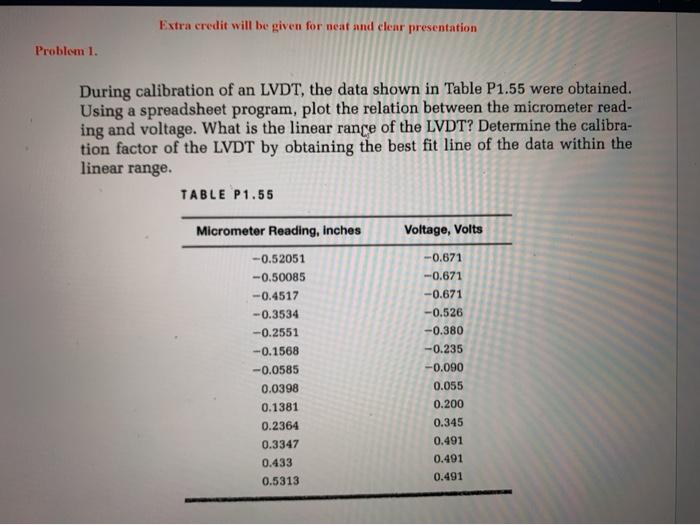
Extra credit will be given for neat and clear presentation Problem 1. During calibration of an LVDT, the data shown in Table P1.55 were obtained. Using a spreadsheet program, plot the relation between the micrometer read- ing and voltage. What is the linear range of the LVDT? Determine the calibra- tion factor of the LVDT by obtaining the best fit line of the data within the linear range. TABLE P1.55 Micrometer Reading, Inches Voltage, Volts -0.52051 -0.50085 -0.4517 -0.3534 -0.2551 -0.1568 -0.0585 0.0398 0.1381 0.2364 0.3347 0.433 0.5313 -0.671 -0.671 -0.671 -0.526 -0.380 -0.235 -0.090 0.055 0.200 0.345 0.491 0.491 0.491
Step by Step Solution
There are 3 Steps involved in it
1 Expert Approved Answer
Step: 1 Unlock

Question Has Been Solved by an Expert!
Get step-by-step solutions from verified subject matter experts
Step: 2 Unlock
Step: 3 Unlock