

Question: You have been employed as a Quality Engineer in a company involved in a high-volume production of nails for DIY. After receiving feedback from customers
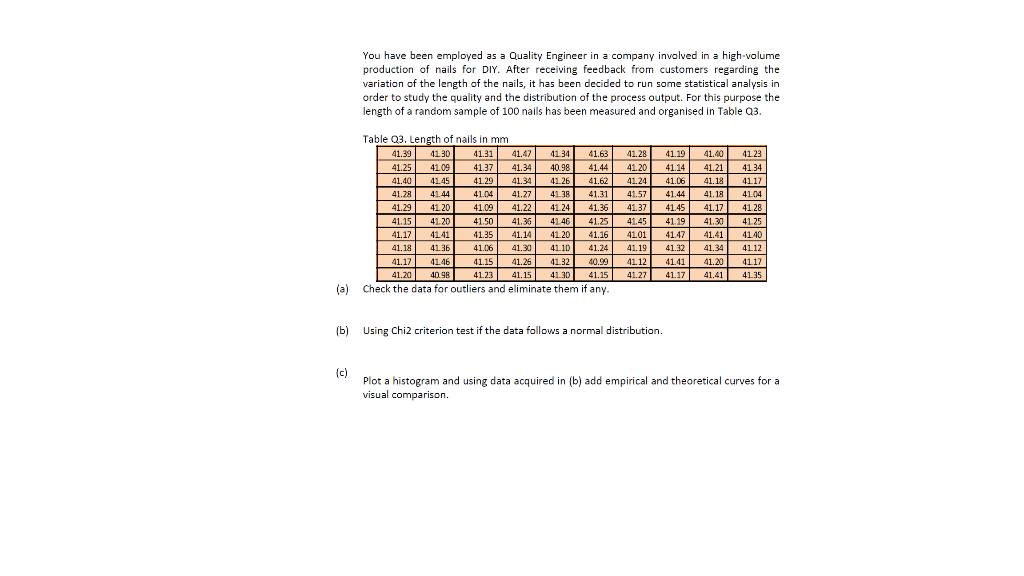
You have been employed as a Quality Engineer in a company involved in a high-volume production of nails for DIY. After receiving feedback from customers regarding the variation of the length of the nails, it has been decided to run some statistical analysis in order to study the quality and the distribution of the process output. For this purpose the length of a random sample of 100 nails has been measured and organised in Table 03. 4123 41.40 41.21 41.18 41.18 41.17 Table Q3. Length of nails in mm 41.39 41.30 41.31 41.47 41.34 41.63 41.25 41.09 41.37 41.34 40.98 41.44 41.40 41.45 41.29 41.34 41 26 41.62 41.28 41.44 41.04 41.27 41.38 41.31 41.29 41.20 41.09 41.22 41.24 41.36 41.15 41.20 41.50 41.35 41.46 41.25 41.17 4141 41.35 41.14 41.20 41.16 41.18 41.36 41.06 41.30 41.10 41.24 41.17 41.15 41.26 41.32 40.99 41.20 40.98 41.23 41.15 4130 41.15 (a) check the data for outliers and eliminate them if any. 41.28 41.20 4124 41.57 41.37 41.45 41.01 41.19 41.12 41.27 41.19 41.14 41.06 41.44 41.45 41.19 41.47 41.32 41.41 41.17 41.30 41.41 41.34 41.20 41.41 41.34 4117 4117 4104 41 28 41.25 41.40 4112 4117 41.35 41 46 (b) Using Chi2 criterion test if the data follows a normal distribution. (c) Plot a histogram and using data acquired in (b) add empirical and theoretical curves for a visual comparison You have been employed as a Quality Engineer in a company involved in a high-volume production of nails for DIY. After receiving feedback from customers regarding the variation of the length of the nails, it has been decided to run some statistical analysis in order to study the quality and the distribution of the process output. For this purpose the length of a random sample of 100 nails has been measured and organised in Table 03. 4123 41.40 41.21 41.18 41.18 41.17 Table Q3. Length of nails in mm 41.39 41.30 41.31 41.47 41.34 41.63 41.25 41.09 41.37 41.34 40.98 41.44 41.40 41.45 41.29 41.34 41 26 41.62 41.28 41.44 41.04 41.27 41.38 41.31 41.29 41.20 41.09 41.22 41.24 41.36 41.15 41.20 41.50 41.35 41.46 41.25 41.17 4141 41.35 41.14 41.20 41.16 41.18 41.36 41.06 41.30 41.10 41.24 41.17 41.15 41.26 41.32 40.99 41.20 40.98 41.23 41.15 4130 41.15 (a) check the data for outliers and eliminate them if any. 41.28 41.20 4124 41.57 41.37 41.45 41.01 41.19 41.12 41.27 41.19 41.14 41.06 41.44 41.45 41.19 41.47 41.32 41.41 41.17 41.30 41.41 41.34 41.20 41.41 41.34 4117 4117 4104 41 28 41.25 41.40 4112 4117 41.35 41 46 (b) Using Chi2 criterion test if the data follows a normal distribution. (c) Plot a histogram and using data acquired in (b) add empirical and theoretical curves for a visual comparison
Step by Step Solution
There are 3 Steps involved in it

Get step-by-step solutions from verified subject matter experts