

Question: You have been presented with the following data and asked to fit statistical demand functions: REGION SALES (Y) ADVERTISING SELLING PRICE (P) DISPOSABLE ('000 gallons)
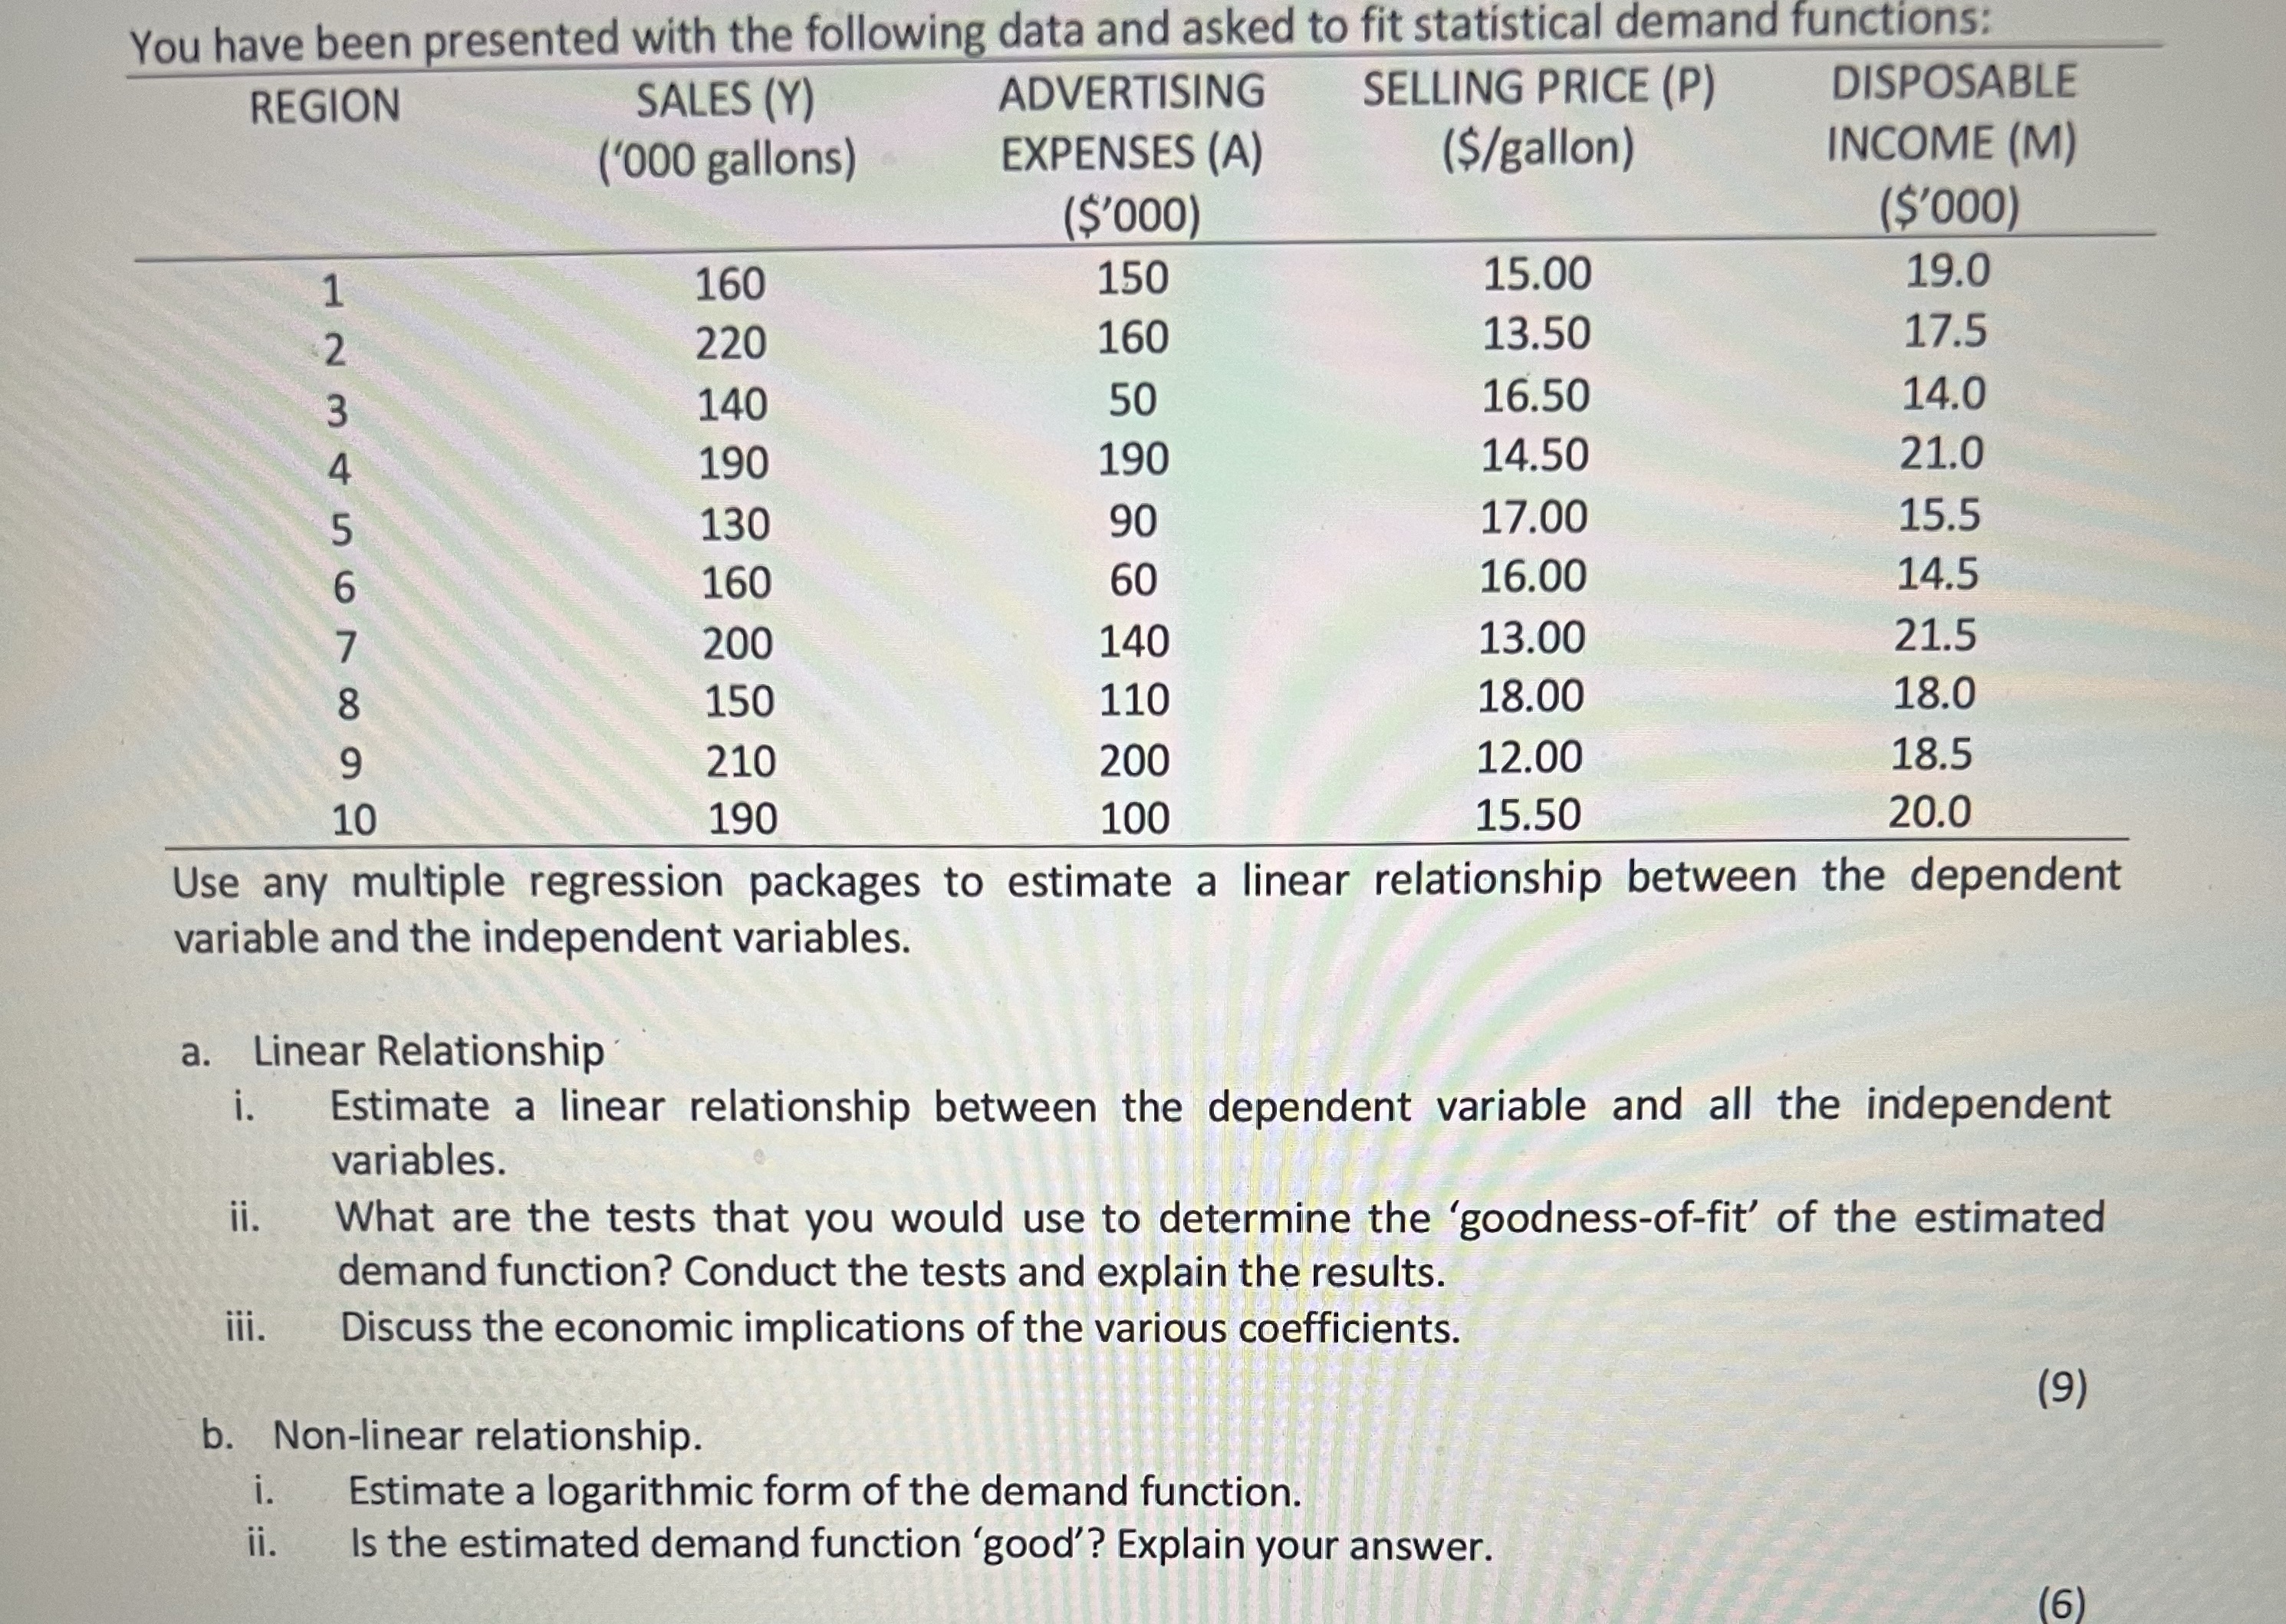
You have been presented with the following data and asked to fit statistical demand functions: REGION SALES (Y) ADVERTISING SELLING PRICE (P) DISPOSABLE ('000 gallons) EXPENSES (A) ($/gallon) INCOME (M) ($'000) ($'000) 160 150 15.00 19.0 220 160 13.50 17.5 140 50 16.50 14.0 190 190 14.50 21.0 130 90 17.00 15.5 160 60 16.00 14.5 200 140 13.00 21.5 150 110 18.00 18.0 210 200 12.00 18.5 190 100 15.50 20.0 Use any multiple regression packages to estimate a linear relationship between the dependent variable and the independent variables. a. Linear Relationship i. Estimate a linear relationship between the dependent variable and all the independent variables. ii. What are the tests that you would use to determine the 'goodness-of-fit' of the estimated demand function? Conduct the tests and explain the results. iii. Discuss the economic implications of the various coefficients. b. Non-linear relationship. (9) i. Estimate a logarithmic form of the demand function. ii. Is the estimated demand function 'good'? Explain your answer. (6)
Step by Step Solution
There are 3 Steps involved in it

Get step-by-step solutions from verified subject matter experts