

Question: You have to construct SPC charts for weight and height. Construction, analysis and insights from SPC are the center piece of this case. Data are
You have to construct SPC charts for weight and height. Construction, analysis and insights from SPC are the center piece of this case. Data are on Exhibit 3 and Exhibit 6. (In have shown you how to draw SPC using the example in the book. It is slightly different here, because they use different data to calculate the x double bar, R bar, upper and lower control limits for x bar charts and R chart. Otherwise the process is not very different.)
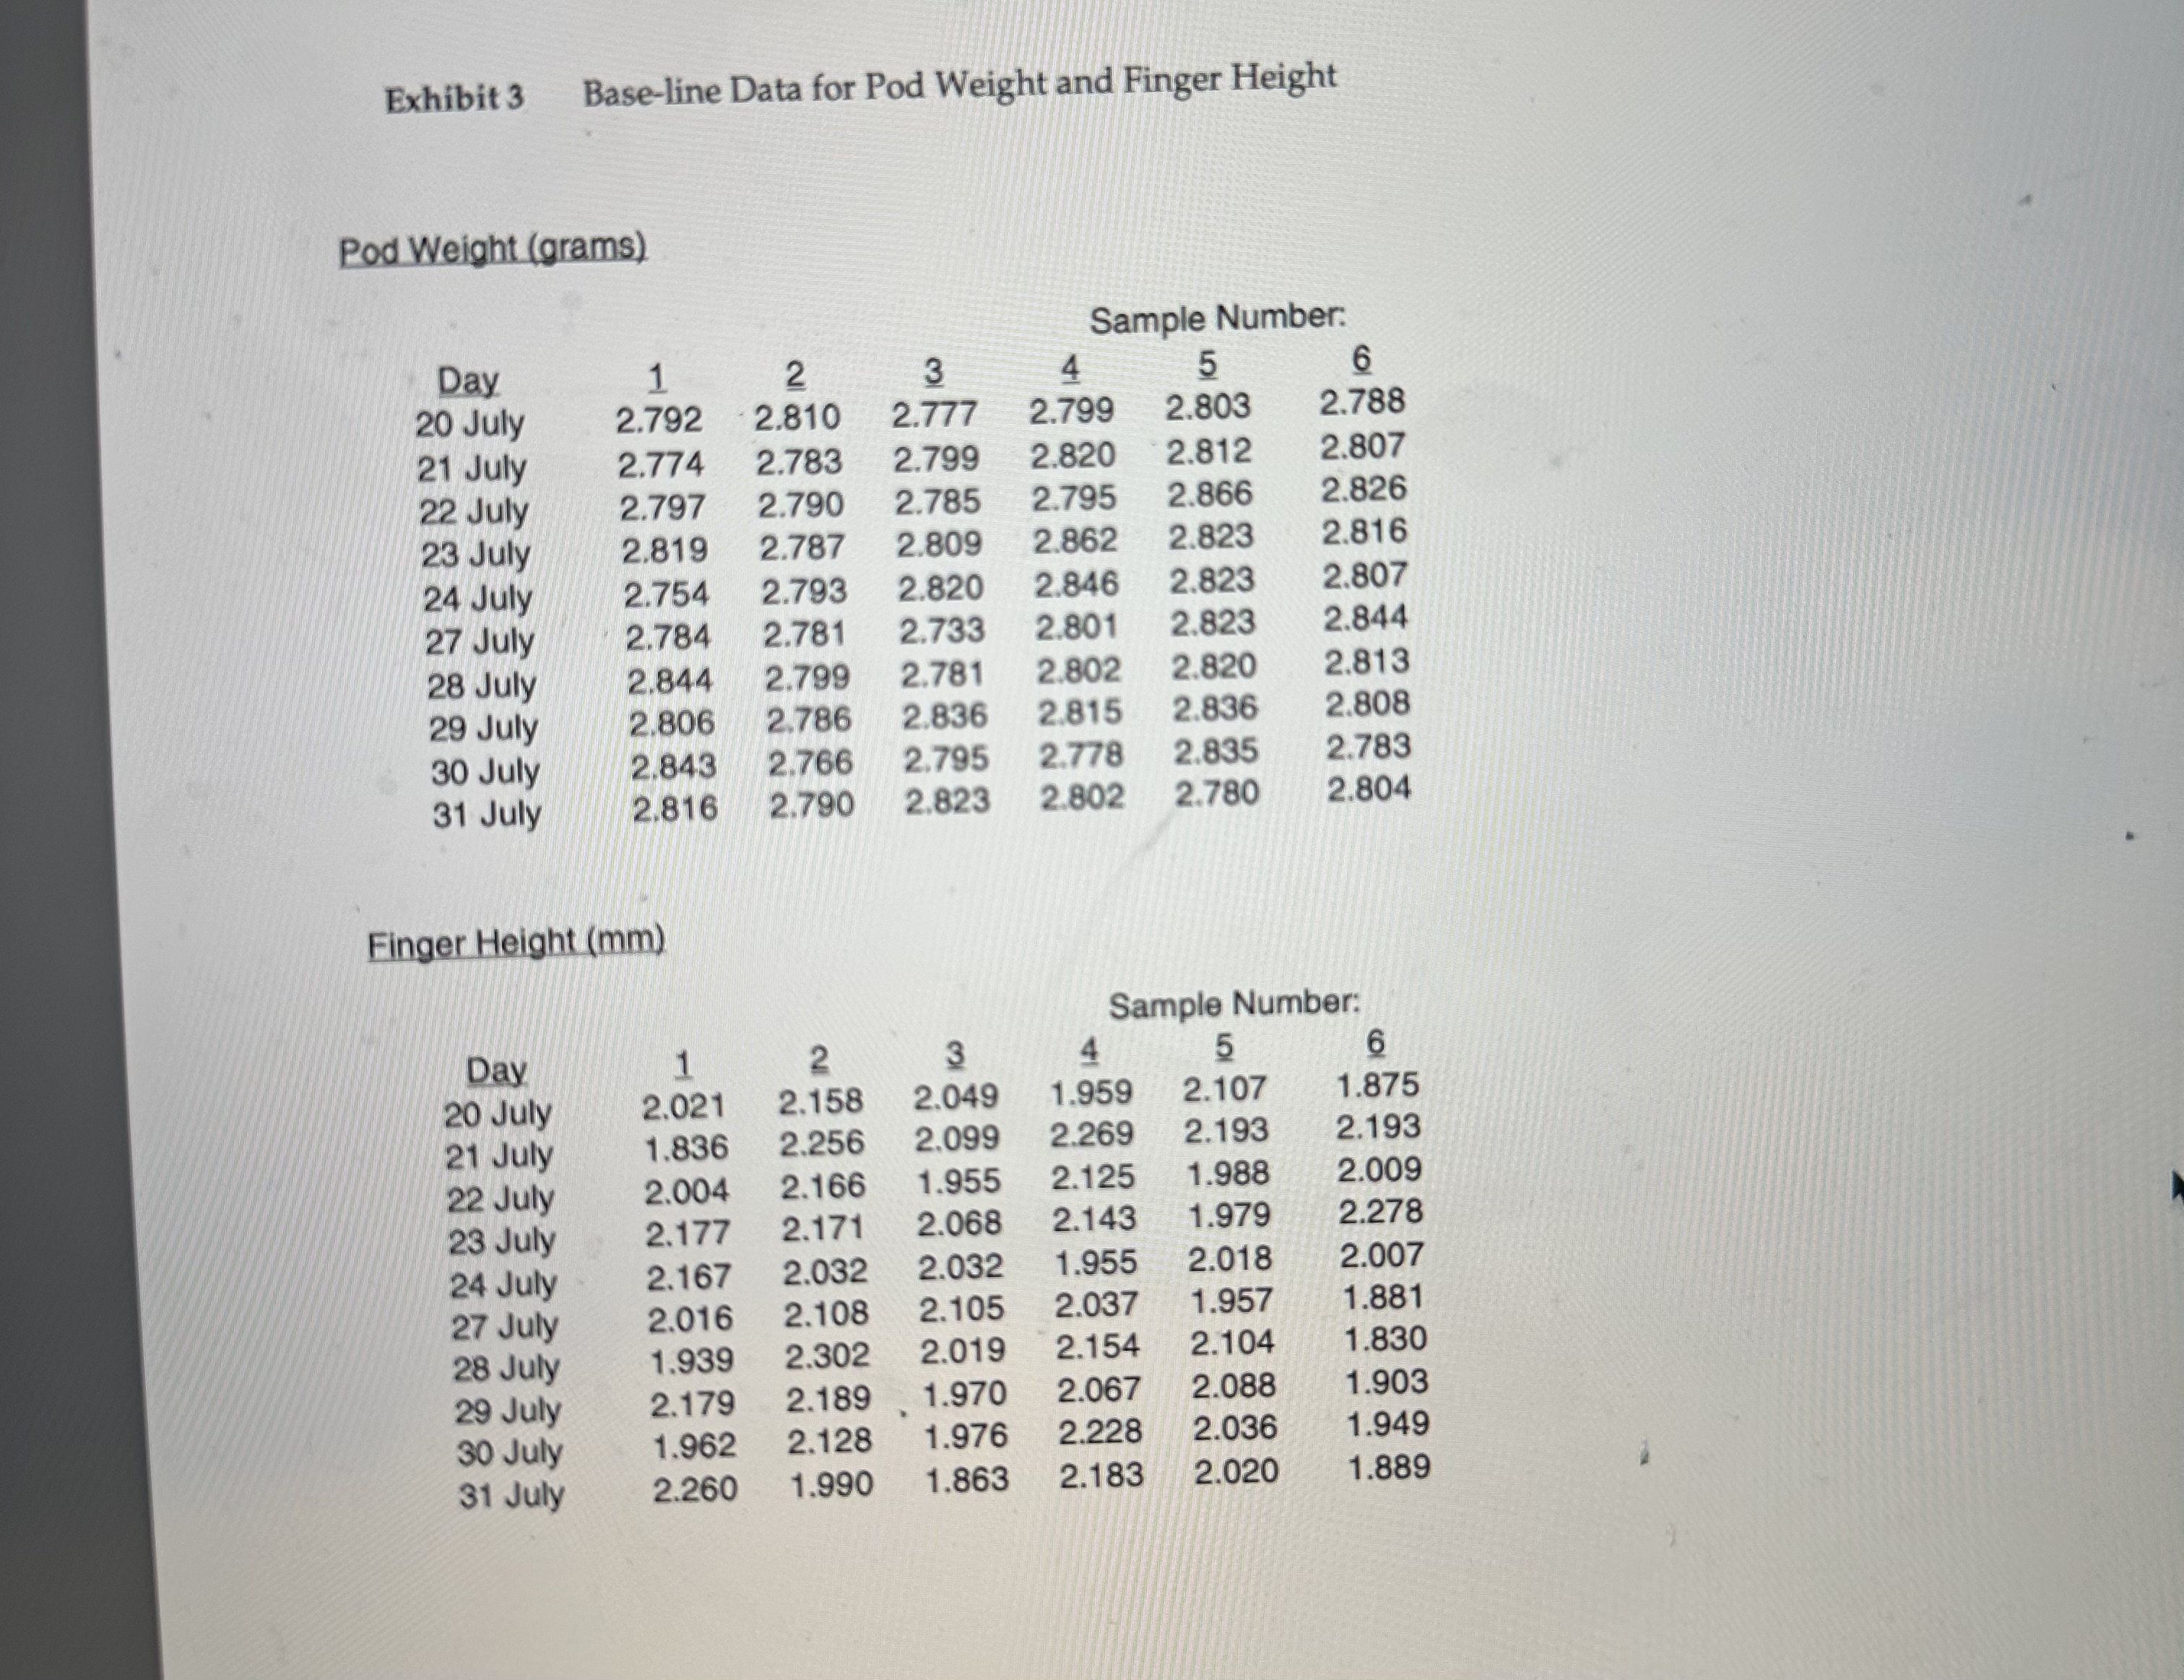
a. Use data on exhibit 3 to find x double bar, R bar, upper and lower control limits for x bar charts and R chart.
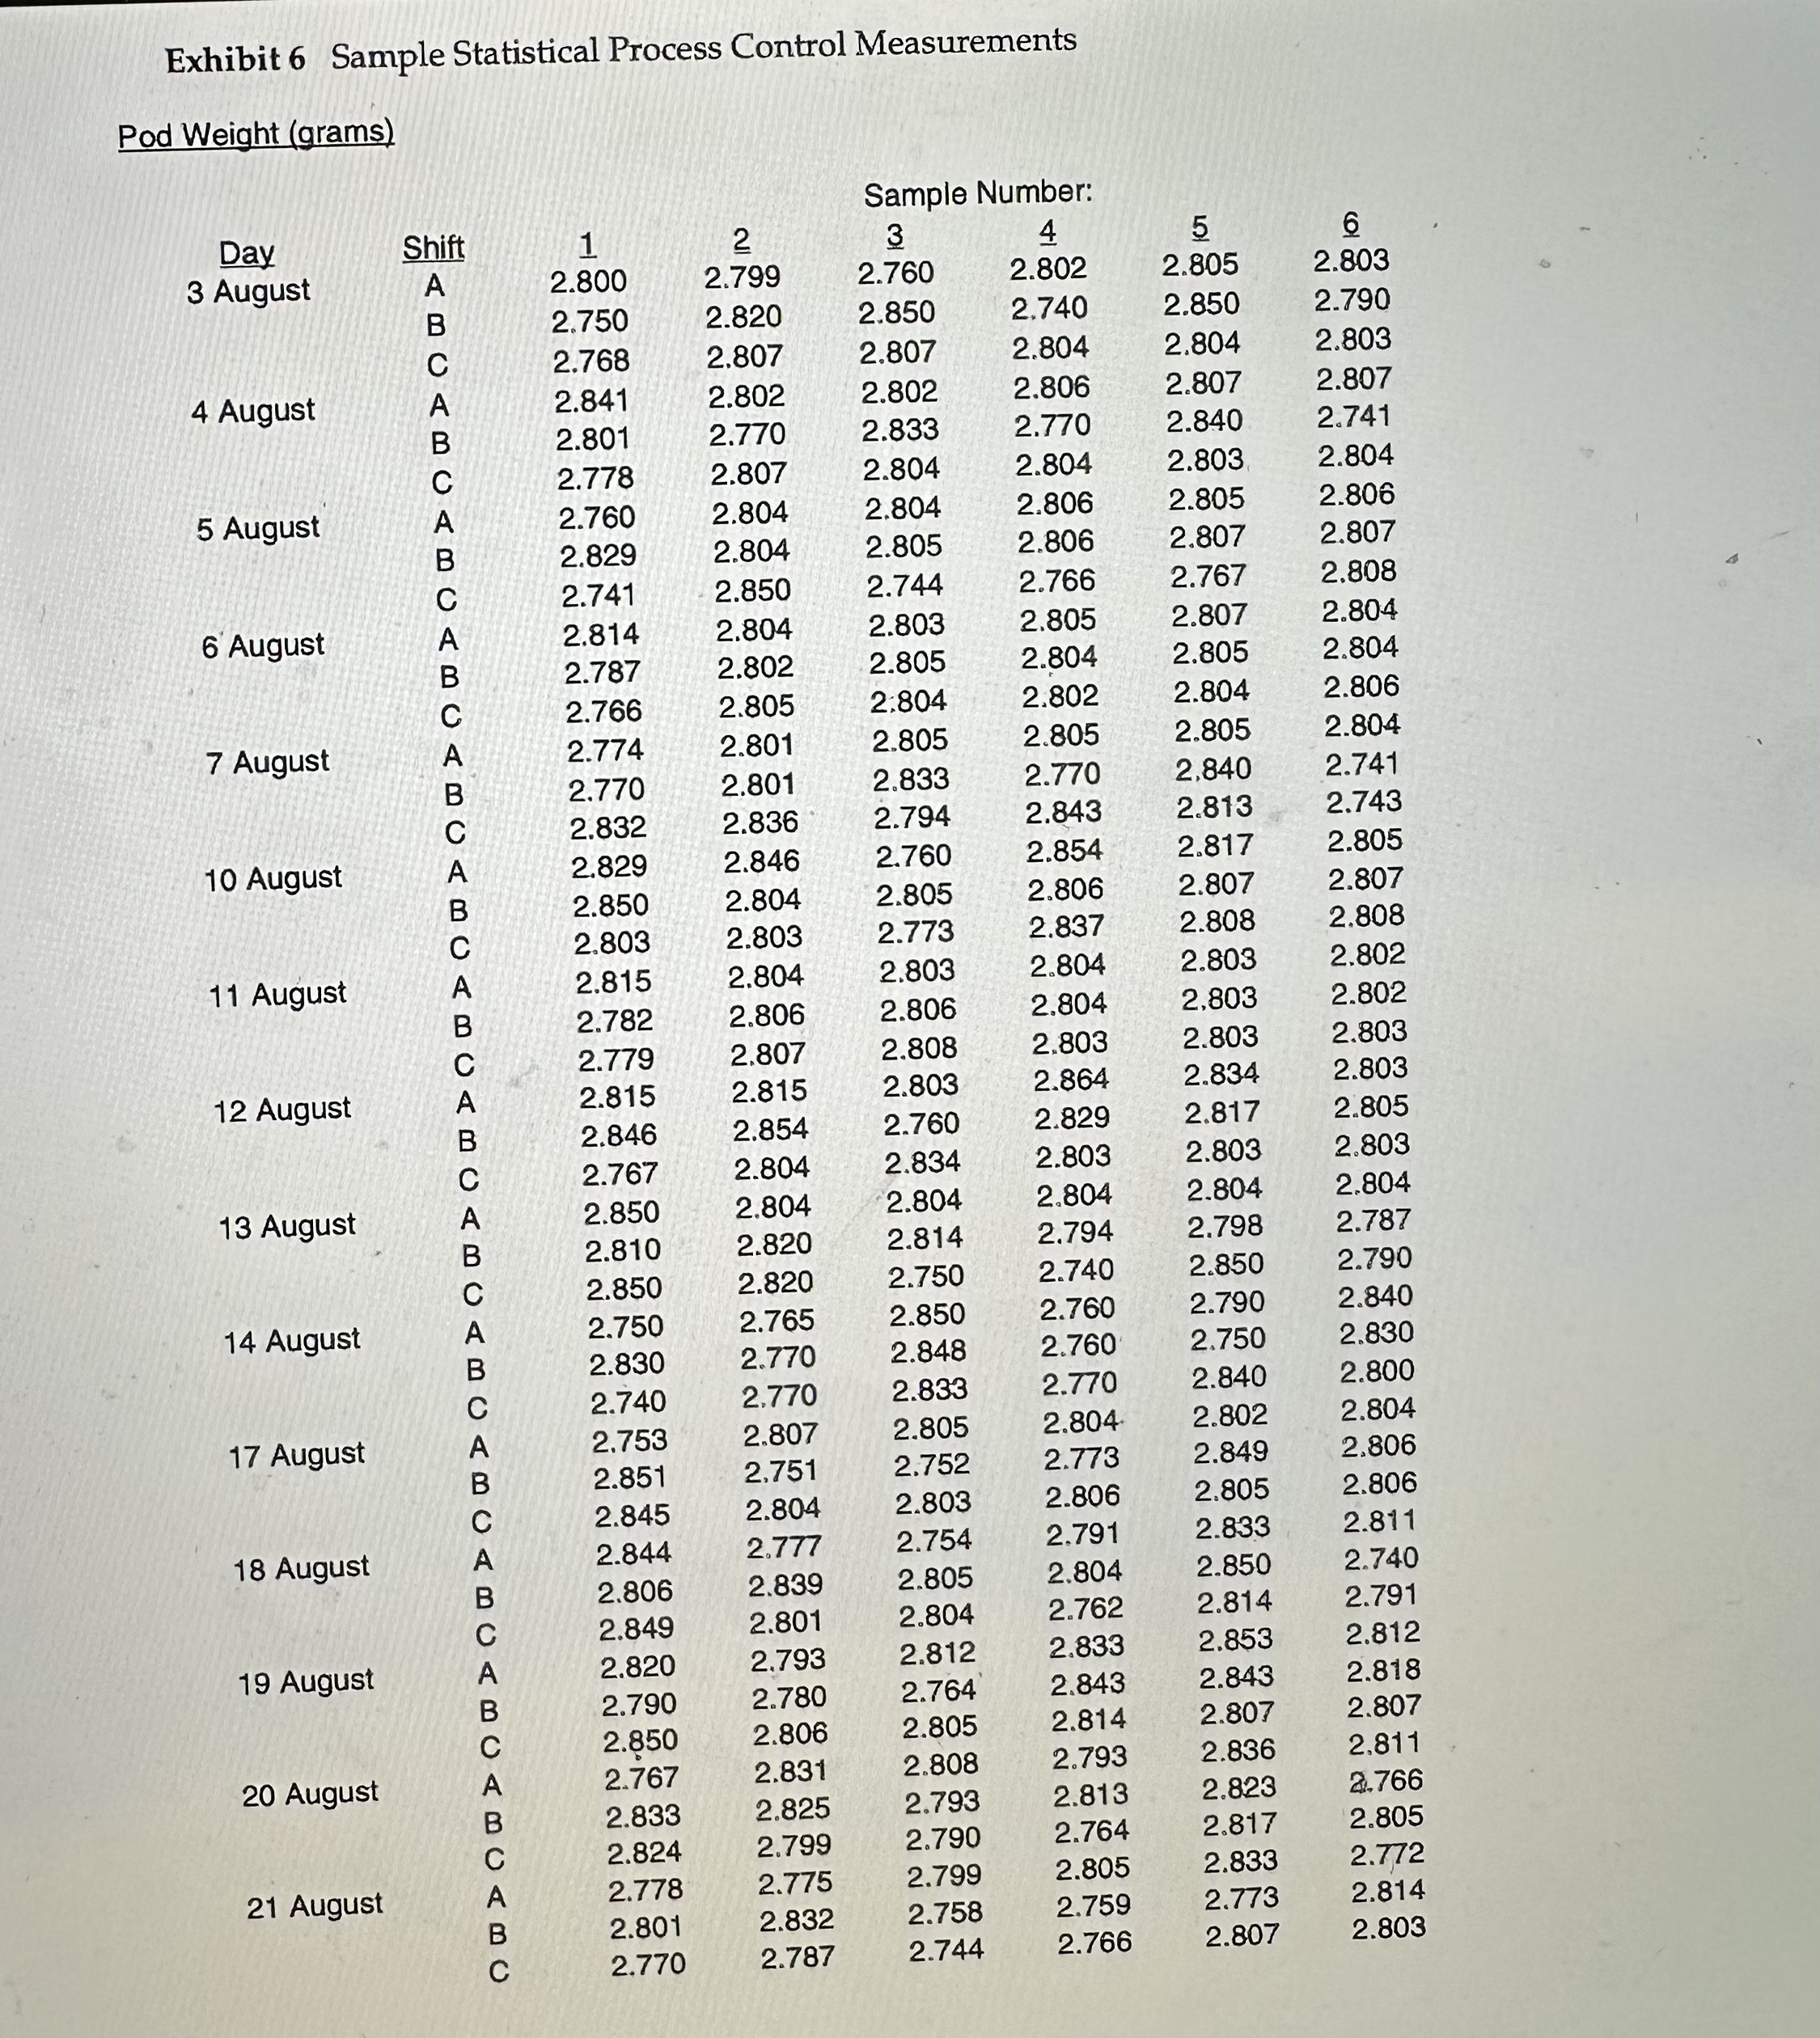
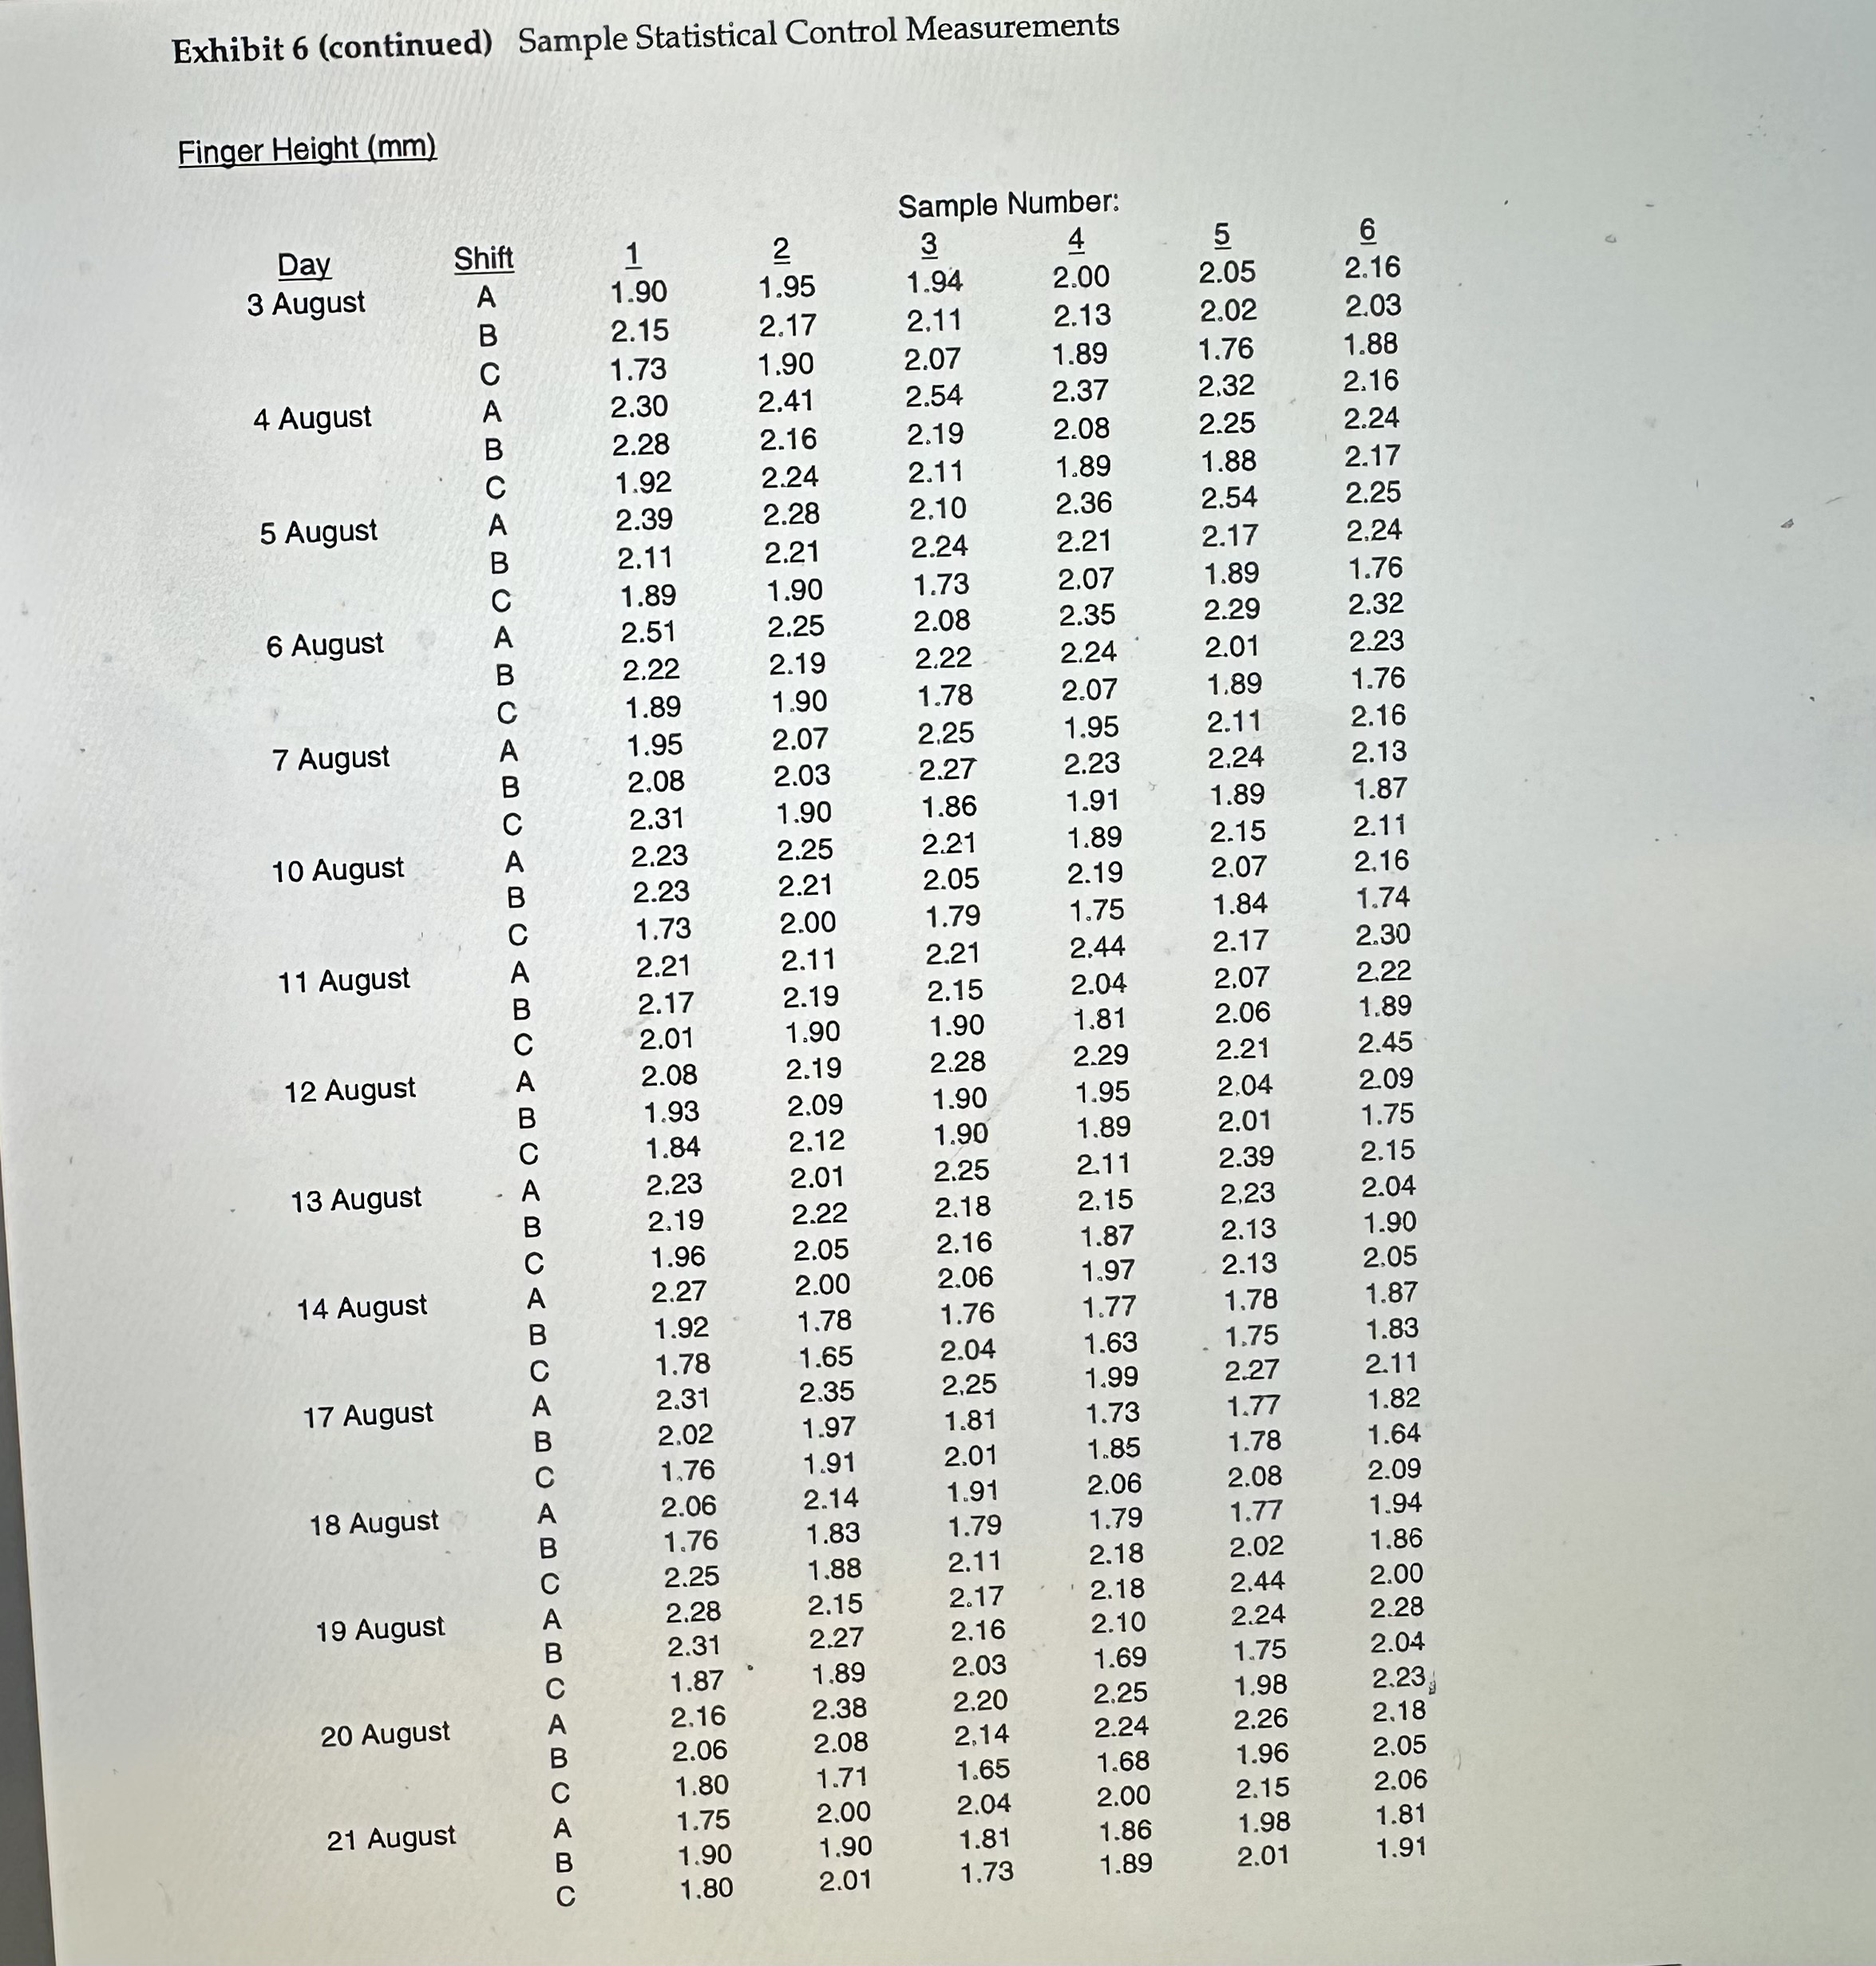
b. Use data on Exhibit 6 to make SPC charts (x bar and R), for weight and height.
Exhibit 3 Base-line Data for Pod Weight and Finger Height Pod Weight (grams) Finger Height ( mm ) Exhibit 6 Sample Statistical Process Control Measurements Exhibit 6 (continued) Sample Statistical Control Measurements Exhibit 3 Base-line Data for Pod Weight and Finger Height Pod Weight (grams) Finger Height ( mm ) Exhibit 6 Sample Statistical Process Control Measurements Exhibit 6 (continued) Sample Statistical Control Measurements
Step by Step Solution
There are 3 Steps involved in it

Get step-by-step solutions from verified subject matter experts