

Question: You made several frequency and phase shift measurements in the lab today. For your homework, you're going to plot this data, producing the Bode plots
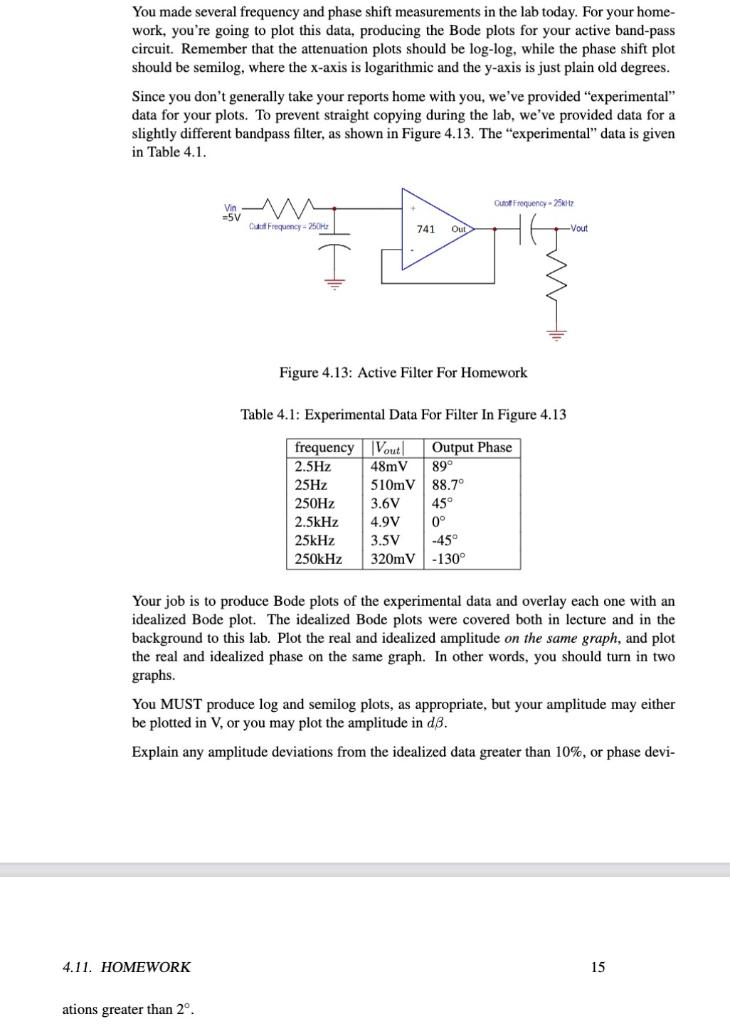
You made several frequency and phase shift measurements in the lab today. For your homework, you're going to plot this data, producing the Bode plots for your active band-pass circuit. Remember that the attenuation plots should be log-log, while the phase shift plot should be semilog, where the x-axis is logarithmic and the y-axis is just plain old degrees. Since you don't generally take your reports home with you, we've provided "experimental" data for your plots. To prevent straight copying during the lab, we've provided data for a slightly different bandpass filter, as shown in Figure 4.13. The "experimental" data is given in Table 4.1. Figure 4.13: Active Filter For Homework Table 4.1: Experimental Data For Filter In Figure 4.13 Your job is to produce Bode plots of the experimental data and overlay each one with an idealized Bode plot. The idealized Bode plots were covered both in lecture and in the background to this lab. Plot the real and idealized amplitude on the same graph, and plot the real and idealized phase on the same graph. In other words, you should turn in two graphs. You MUST produce log and semilog plots, as appropriate, but your amplitude may either be plotted in V, or you may plot the amplitude in d. Explain any amplitude deviations from the idealized data greater than 10%, or phase devi
Step by Step Solution
There are 3 Steps involved in it

Get step-by-step solutions from verified subject matter experts