

Question: You may need to use the appropriate appendix table to answer this question. This question is a what-if analysis designed to determine what happens to
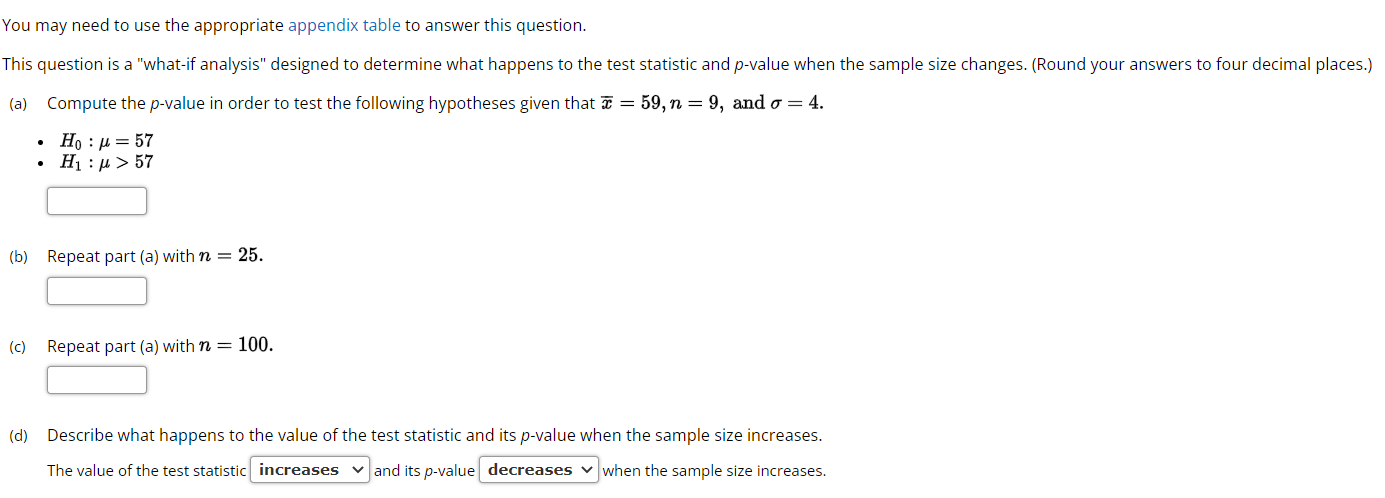
You may need to use the appropriate appendix table to answer this question. This question is a "what-if analysis" designed to determine what happens to the test statistic and p-value when the sample size changes. (Round your answers to four decimal places.) (a) Compute the p-value in order to test the following hypotheses given that = = 59, n = 9, and o = 4. . Ho : M = 57 . H1 : 4 > 57 (b) Repeat part (a) with n = 25. (c) Repeat part (a) with n = 100. (d) Describe what happens to the value of the test statistic and its p-value when the sample size increases. The value of the test statistic increases v and its p-value decreases v when the sample size increases
Step by Step Solution
There are 3 Steps involved in it

Get step-by-step solutions from verified subject matter experts