

Question: You may need to use the appropriate technology to answer this question. Use the sample data below to test the hypotheses Pi Ho P1
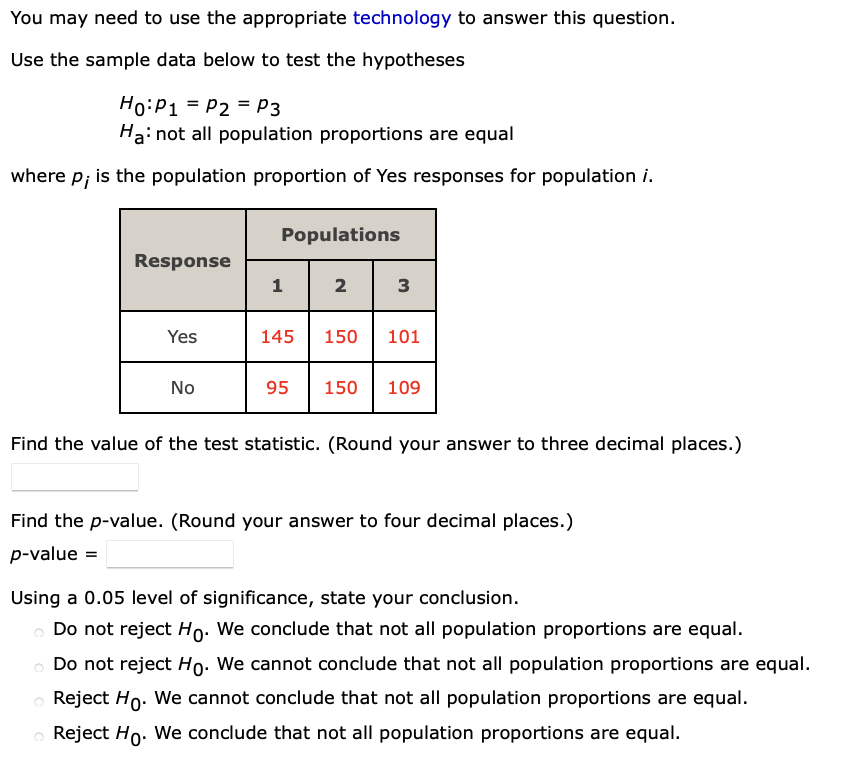
You may need to use the appropriate technology to answer this question. Use the sample data below to test the hypotheses Pi Ho P1 P2 P3 Ha: not all population proportions are equal is the population proportion of Yes responses for population i. Response Populations 1 2 3 Yes 145 150 101 No 95 150 109 Find the value of the test statistic. (Round your answer to three decimal places.) Find the p-value. (Round your answer to four decimal places.) p-value = Using a 0.05 level of significance, state your conclusion. Do not reject Ho. We conclude that not all population proportions are equal. Do not reject Ho. We cannot conclude that not all population proportions are equal. Reject Ho. We cannot conclude that not all population proportions are equal. Reject Ho. We conclude that not all population proportions are equal.
Step by Step Solution
There are 3 Steps involved in it

Get step-by-step solutions from verified subject matter experts