

Question: You may need to use this table to answer this question. A process sampled 2 0 times with a sample of size 8 resulted in
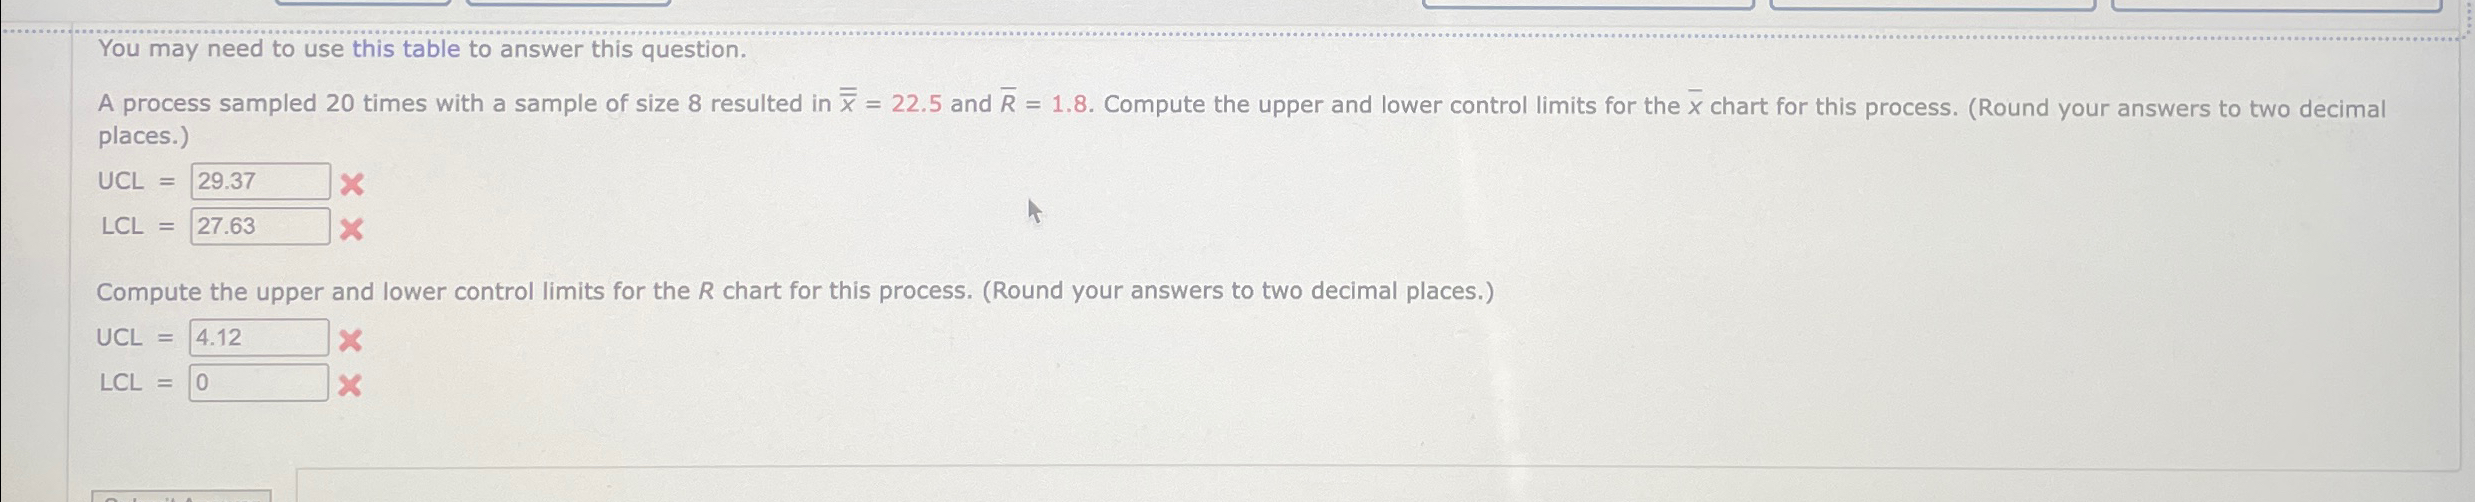
You may need to use this table to answer this question.
A process sampled times with a sample of size resulted in and Compute the upper and lower control limits for the chart for this process. Round your answers to two decimal places.
UCL
Compute the upper and lower control limits for the chart for this process. Round your answers to two decimal places.
UCL
Step by Step Solution
There are 3 Steps involved in it
1 Expert Approved Answer
Step: 1 Unlock

Question Has Been Solved by an Expert!
Get step-by-step solutions from verified subject matter experts
Step: 2 Unlock
Step: 3 Unlock