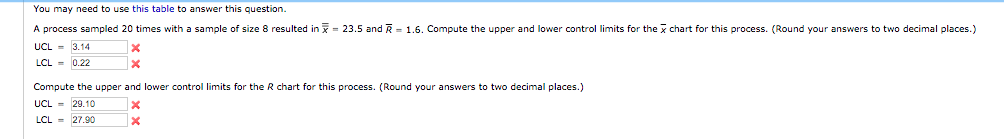
Question: You may need to use this table to answer this question. A process sampled 20 times with a sample of size 8 resulted in x-23.5

You may need to use this table to answer thisYou may need to use this table to answer this

You may need to use this table to answer this question. A process sampled 20 times with a sample of size 8 resulted in x-23.5 and R - 1.6. Compute the upper and lower control limits for the chart for this process. (Round your answers to two decimal places.) UCL = 3.14 LCL = 0.22 Compute the upper and lower control limits for the R chart for this process. (Round your answers to two decimal places.) UCL = 29.10 LCL = 27.30 . Temperature is used to measure the output of a production process. When the process is in control, the mean of the process is u = 122.5 and the standard deviation is o = 0.3. (a) Compute the upper and lower control limits if samples of size 5 are to be used. (Round your answers to two decimal places.) UCL = LCL =

Step by Step Solution

There are 3 Steps involved in it

1 Expert Approved Answer
Step: 1 Unlock blur-text-image
Question Has Been Solved by an Expert!

Get step-by-step solutions from verified subject matter experts

Step: 2 Unlock
Step: 3 Unlock

Students Have Also Explored These Related General Management Questions!