

Question: YOU MUST USE SIMIO TO ANSWER THIS QUESTION!!!!!!!!!!!!!! Based on this description, what would be some goals or purposes of using a discrete event simulation
YOU MUST USE SIMIO TO ANSWER THIS QUESTION!!!!!!!!!!!!!!
Based on this description, what would be some goals or purposes of using a discrete event
simulation to analyze the warehouse and distribution center? Provide at least purposes.
What output metrics would you track in a simulation to help inform those goals or
purposes?
How would you simplify the warehouse and distribution center to allow you to create a
simulation in Simio based on your current knowledge of Simio ie Week and labs
where the only entities are individual products? Provide a flow chart for such a simulation.
What assumptions do you need to make in order to accomplish question
If you want to simulate the arrival of products to align with your simplification in question
how could you change Table so that the table represents products per hour? What
distribution could you use to model the arrival rate?
Assume the arrival rate of orders is known and that there is a known distribution for the
number of electronics per order, the number of clothes per order, the number of household
items per order, and the number of perishables per order. Draw a new flow chart for a
simulation where the orders are entities and you want to simulate the time for an order to
be completed and moved to the Shipping area. Hint: Assume that an order is never delayed
due to lack of products. You have been asked to evaluate the operations of a warehouse and distribution center. The center handles the storage and distribution of various products to retail stores. The warehouse operates and consists of several key areas: Receiving, Storage, Picking, Packing, and Shipping. Each area has unique characteristics and challenges that need to be addressed through simulation modeling.
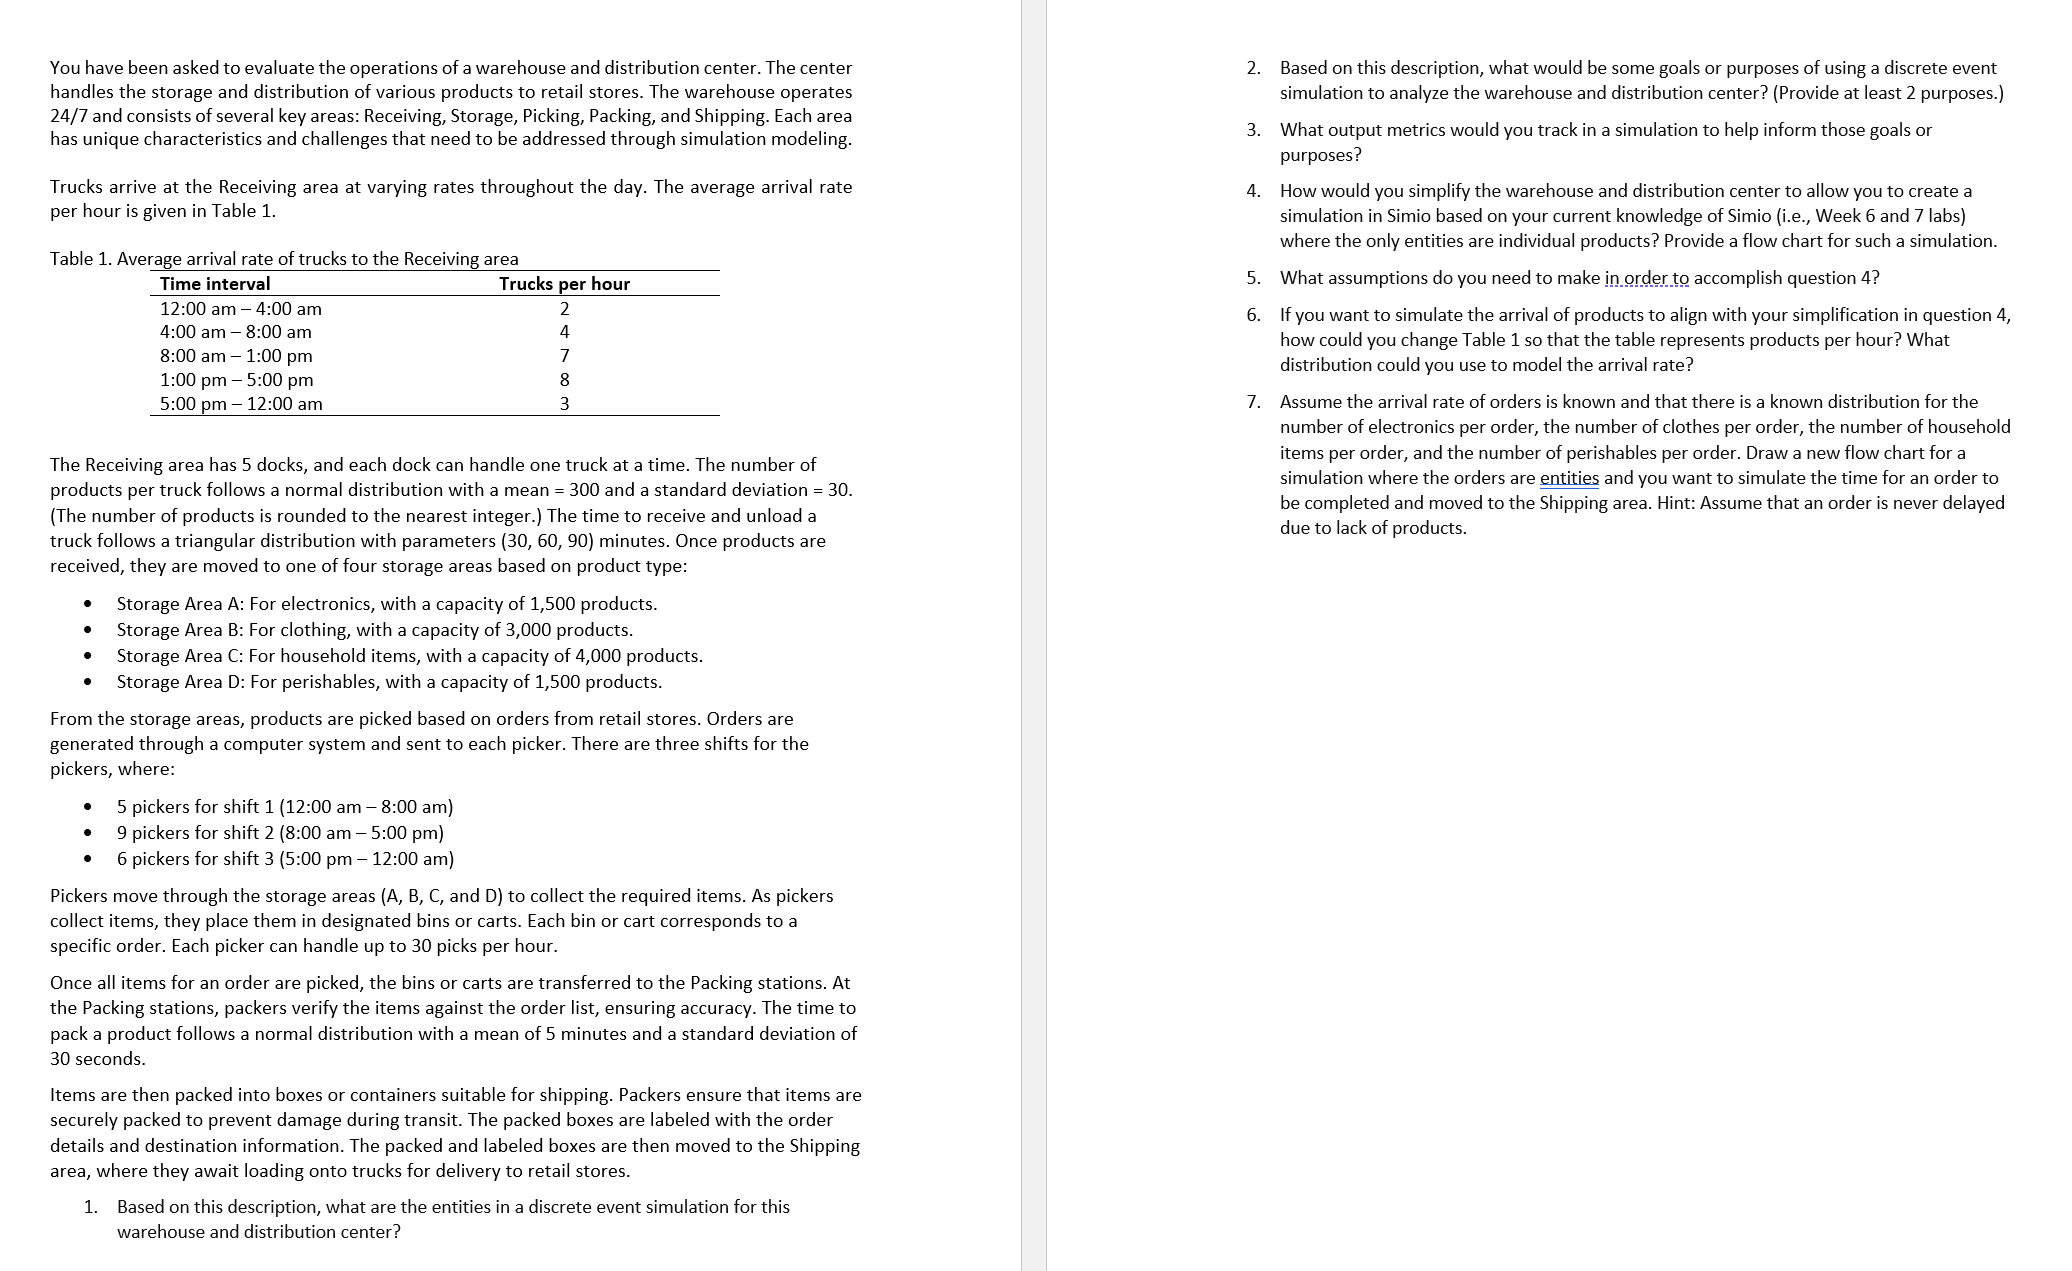
Trucks arrive at the Receiving area at varying rates throughout the day. The average arrival rate per hour is given in Table
Table
A
age arrival rate of trucks to the Receiving area
The Receiving area has docks, and each dock can handle one truck at a time. The number of products per truck follows a normal distribution with a mean and a standard deviation The number of products is rounded to the nearest integer. The time to receive and unload a truck follows a triangular distribution with parameters minutes. Once products are received, they are moved to one of four storage areas based on product type:
Storage Area A: For electronics, with a capacity of products.
Storage Area B: For clothing, with a capacity of products.
Storage Area C: For household items, with a capacity of products.
Storage Area D: For perishables, with a capacity of products.
From the storage areas, products are picked based on orders from retail stores. Orders are generated through a computer system and sent to each picker. There are three shifts for the pickers, where:
pickers for shift : am : am
pickers for shift : am : pm
pickers for shift : pm : am
Pickers move through the storage areas A B C and D to collect the required items. As pickers collect items, they place them in designated bins or carts. Each bin or cart corresponds to a specific order. Each picker can handle up to picks per hour.
Once all items for an order are picked, the bins or carts are transferred to the Packing stations. At the Packing stations, packers verify the items against the order list, ensuring accuracy. The time to pack a product follows a normal distribution with a mean of minutes and a standard deviation of seconds. Items are then packed into boxes or containers suitable for shipping. Packers ensure that items are securely packed to prevent damage during transit. The packed boxes are labeled with the order details and destination information. The packed and labeled boxes are then moved to the Shipping area, where they await loading onto trucks for delivery to retail stores.
Based on this description, what are the entities in a discrete event simulation for this warehouse and distribution center?
Based on this description, what would be some goals or purposes of using a discrete event simulation to analyze the warehouse and distribution center? Provide at least purposes.
What output metrics would you track in a simulation to help inform those goals or purposes?
How would you simplify the warehouse and distribution center to allow you to create a simulation in Simio based on your current knowledge of Simio ie Week and labs where the only entities are individual products? Provide a flow chart for such a simulation.
What assumptions do you need to make in order to accomplish question
If you want to simulate the arrival of products to align with your simplification in question how could you change Table so that the table represents products per hour? What distribution could you use to model the arrival rate?
Assume the arrival rate of orders is known and that there is a known distributio
Step by Step Solution
There are 3 Steps involved in it
1 Expert Approved Answer
Step: 1 Unlock

Question Has Been Solved by an Expert!
Get step-by-step solutions from verified subject matter experts
Step: 2 Unlock
Step: 3 Unlock