

Question: You need to create a scatter plot that shows the relationship between two continuous measures. Where on the worksheet should fields be placed to create
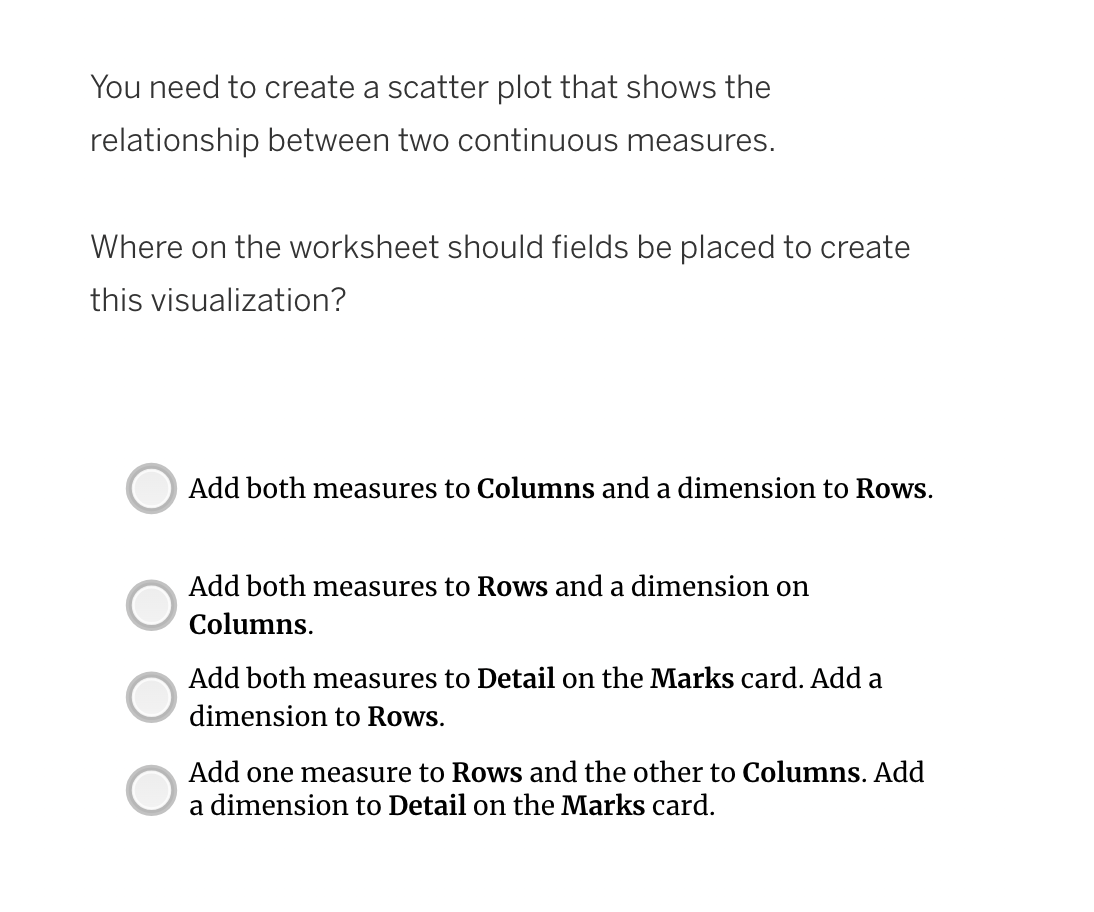
You need to create a scatter plot that shows the relationship between two continuous measures. Where on the worksheet should fields be placed to create this visualization? Add both measures to Columns and a dimension to Rows. Add both measures to Rows and a dimension on Columns. Add both measures to Detail on the Marks card. Add a dimension to Rows. Add one measure to Rows and the other to Columns. Add a dimension to Detail on the Marks card
Step by Step Solution
There are 3 Steps involved in it
1 Expert Approved Answer
Step: 1 Unlock

Question Has Been Solved by an Expert!
Get step-by-step solutions from verified subject matter experts
Step: 2 Unlock
Step: 3 Unlock